Bitcoin Has Failed to Breach $6,000 Five Times, Has it Bottomed?

Bitcoin is slightly up today to $6,400 on slightly increased volumes of more than $4 billion for the past 24 hours.
It is a level the currency has maintained for now months, with bitcoin trying five times to breach $6,000, but every time it has briefly done so, it has quickly jumped to above $6,000.
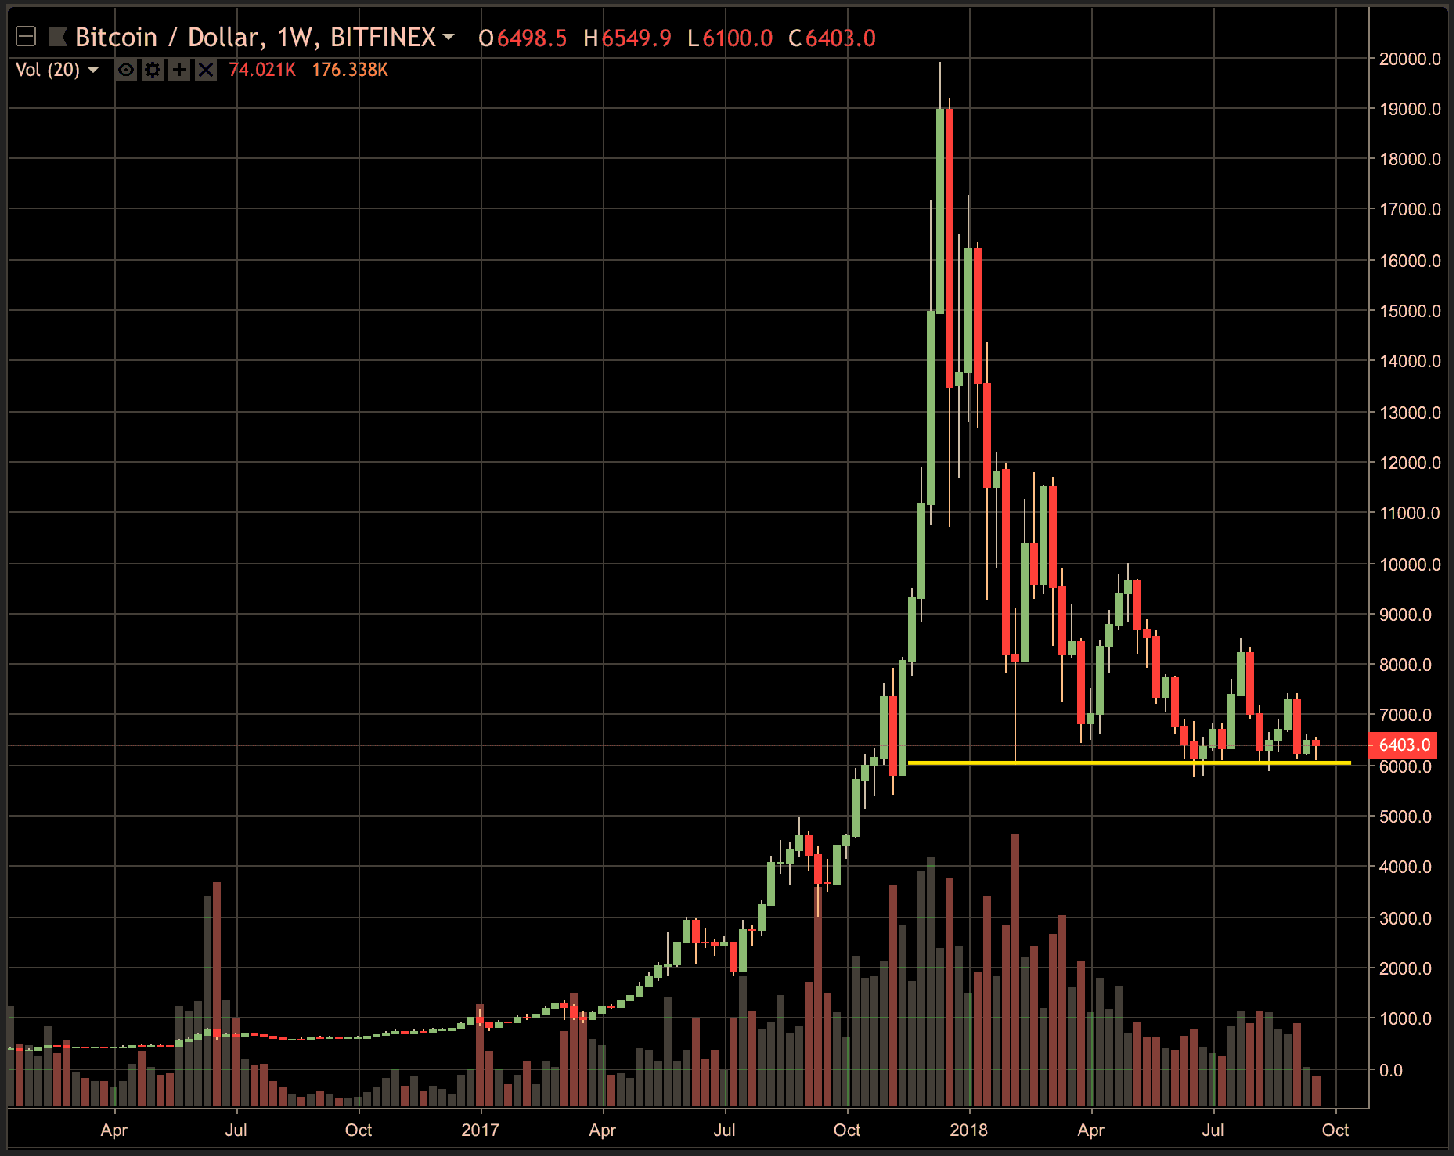
As can be seen above, the first time bitcoin tried to breach $6,000 was on the 5th of February. It managed to do so, but only briefly as price quickly jumps and goes on to double to $12,000 in March.
It then falls again in April to around $6,000, but strong support leads to a bounce just as May opens, reaching $10,000.
In June and for the beginning of summer price drops again to just below $6,000, reaching $5,700, but doesn’t stay there as it goes on to $8,500 in July.
Then, $5,700 again in August, a bounce off to $7,500 in September and now to $6,400 where it has roughly stayed for the past two weeks.
Looking at this even visually we can see a huge triangle. Traders call it the meme triangle, for it is so big it has been turned into a meme of sorts.
Its primary feature is lower highs, while there are no lower lows. What that means exactly depends on whether you want to be bullish or bearish because in line with that fortune telling tradition this tells us whatever we want to believe. Here is a technical analysis site describing it:
“The descending triangle is a bearish formation that usually forms during a downtrend as a continuation pattern. There are instances when descending triangles form as reversal patterns at the end of an uptrend, but they are typically continuation patterns.”
So it could go up or it could go down and before it does either of them it will sideways. Or as traders like to call it, we have to wait and see which way this breaks out.
In other coins, however, it might be more clear that there is a local bottom of sorts. Here is ethereum for example on weekly candles:
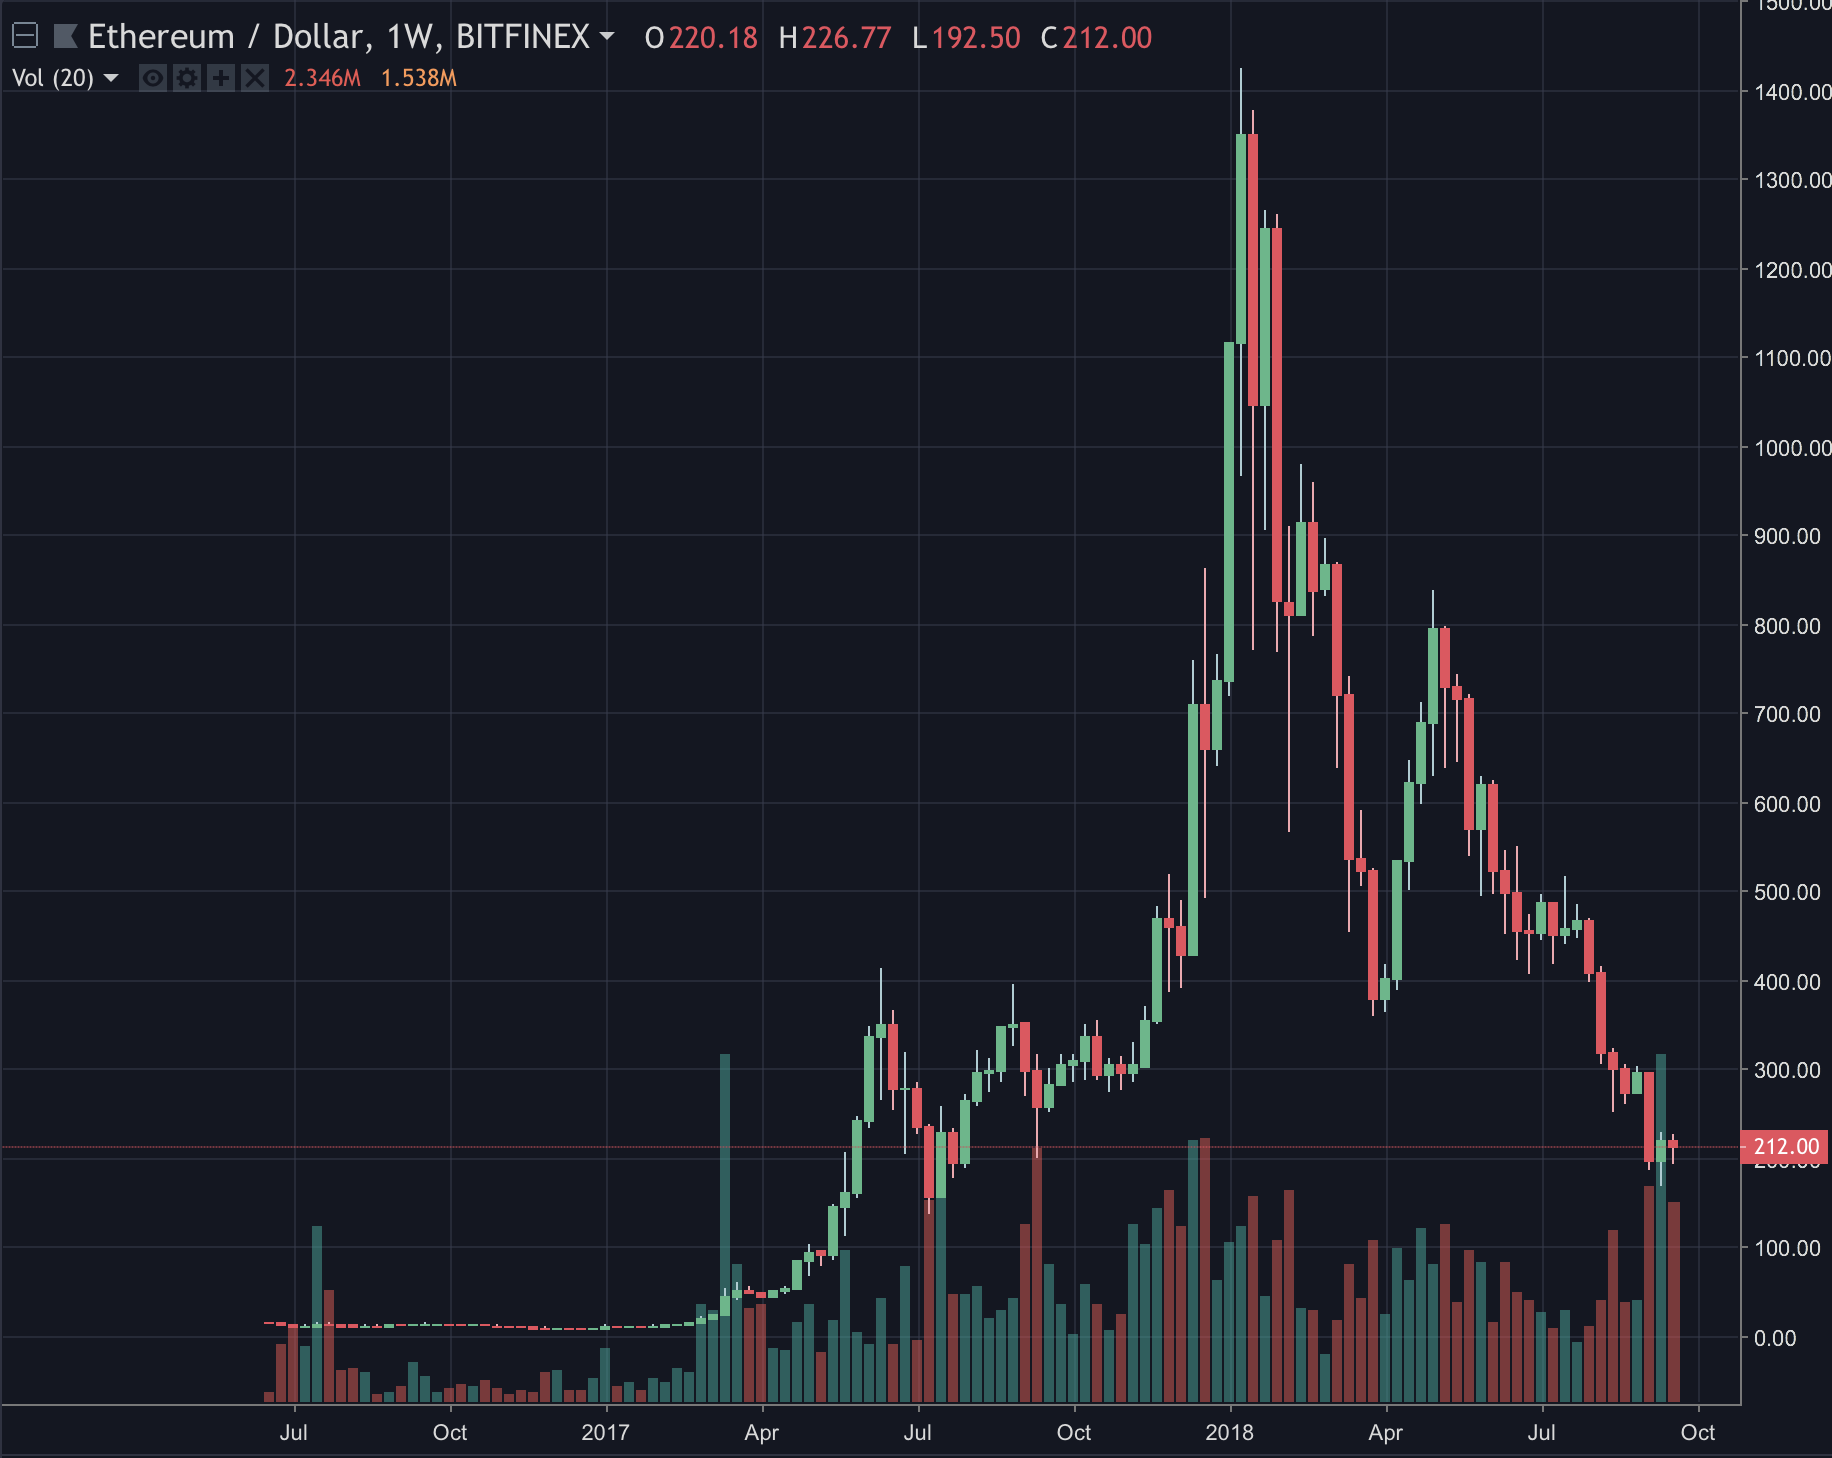
As can be seen above, ethereum’s chart is quite different to bitcoin in that it hasn’t found a floor, but the two recent candles are interesting as bulls came back with vengeance while volumes skyrocketed to close a green candle.
Moreover other coins have seen a fall of 95%-99% with some apparently fed up with it, including Ripple which has been very bullish recently, jumping 20% a day and another 20% today, dragging up eth and bitcoin with it.
So it may well be that a bottom has been found after nine months of selling, but whether that is indeed the case, remains to be seen this autumn.
Copyrights Trustnodes.com


Article comments