Bitcoin Got Over Head and Shoulders Says This Week’s Crypto TA

Bitcoin is moving slightly up, failing once again to reverse. The major crypto is aiming to break out $6,000, and the market overall may continue rising soon.
Bitcoin
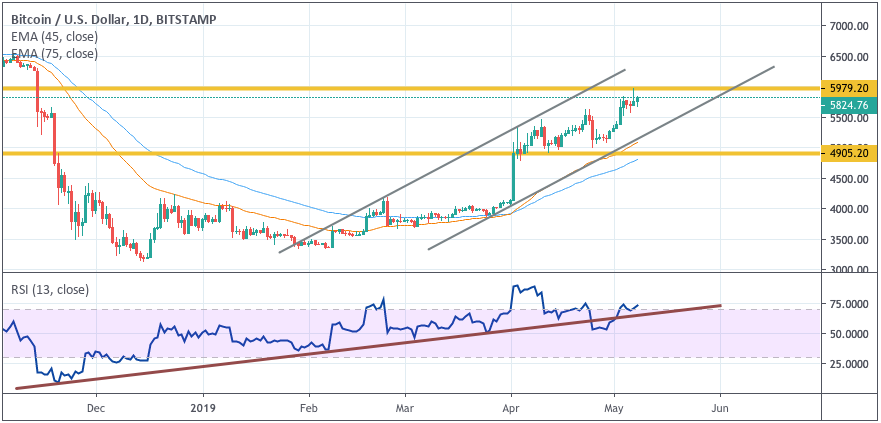
On D1, BTC is persisting in trying to break out $6,000. In case it succeeds, the price may well continue rising to $7,000. A slight correction may be expected soon, but the price is then likely to get back.
By hitting $5,500, BTC got over head and shoulders, which is another good signal for an uptrend (the next target lies at $6,400), especially if the RSI bounces off the support.
Price is above the trend line now, but in case BTCUSD closes below the lower boundary at $4,900, a fall will be likely, sending the price to around $4,000.
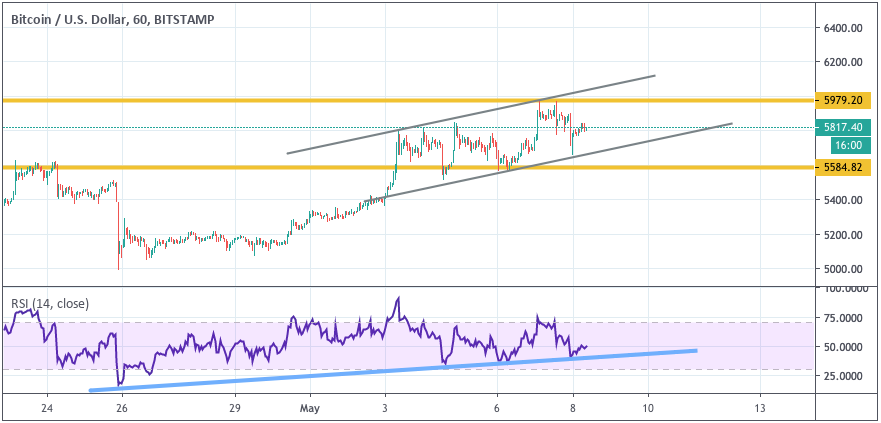
On H1, BTC is moving along an ascending channel. RSI is confirming the uptrend by once again bouncing off the support.
After the lower channel boundary gets tested, price is likely to rise once resistance is broken out and BTC stays above $5,995.
Conversely, in case BTCUSD hits the lower boundary top down, the downside correction may continue to $5,200.
EOSeval(ez_write_tag([[300,250],'trustnodes_com-medrectangle-4','ezslot_1',169,'0']));
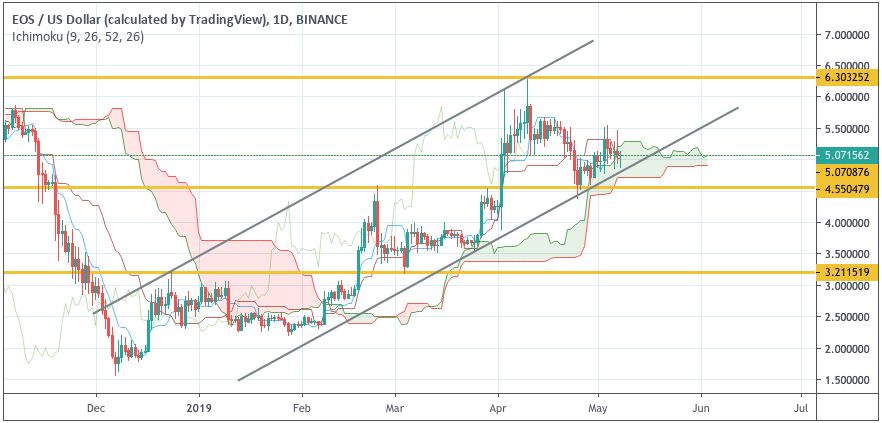
EOS is moving along an ascending channel, trading near the Ichimoku cloud, which shows the price is flat.
On D1, the price may go down slightly to test the lower cloud area at $5.05, and then rise to $6.30, which will be confirmed in case the lower boundary of the ascending channel gets bounced off, as well as with the price closing above the cloud area at $5.60.
Conversely, in case the bottom cloud area gets broken out and the price closes below $4.50, it will likely head down towards $3.20.
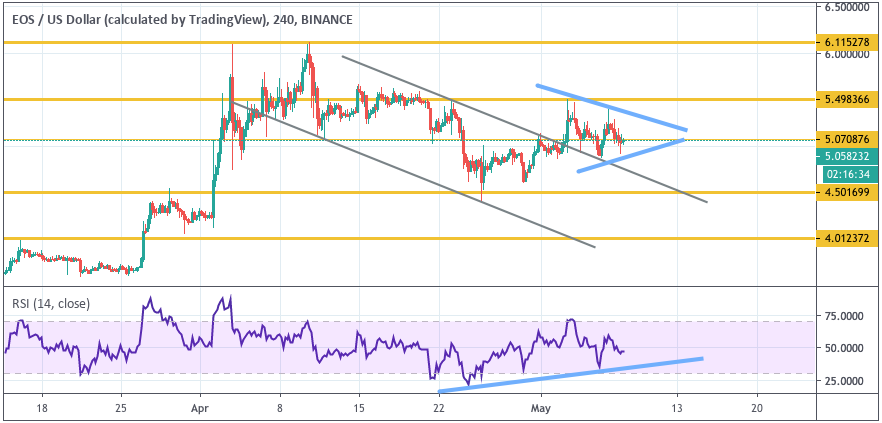
On H1, EOS is forming a triangle, which means the volatility is fading out before a large move.
Price is above the upper channel boundary and is aimed at $6.10, which will be confirmed once the upper boundary of the triangle gets broken out and the price closes above $5.50.
Conversely, if the lower boundary is broken out and the price closes below $4.50, the pullback may send it below $4.00.
Ethereumeval(ez_write_tag([[580,400],'trustnodes_com-box-4','ezslot_3',171,'0']));
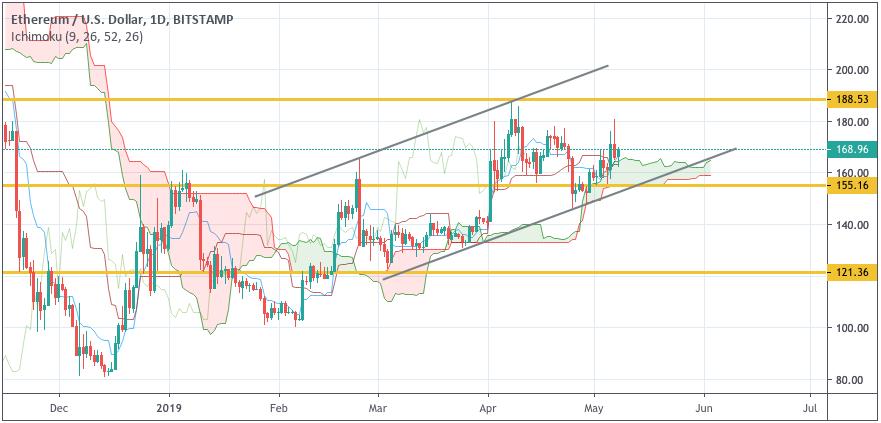
ETH is moving along an ascending channel. On D1, the price is bouncing off the upper Ichimoku cloud boundary, which confirms the uptrend.
Moreover, the support at $155 is still here to stay. After testing $160, eth may continue rising and is likely to hit $190.
Conversely, if price falls below the lower channel and cloud boundary, it may head towards $120.
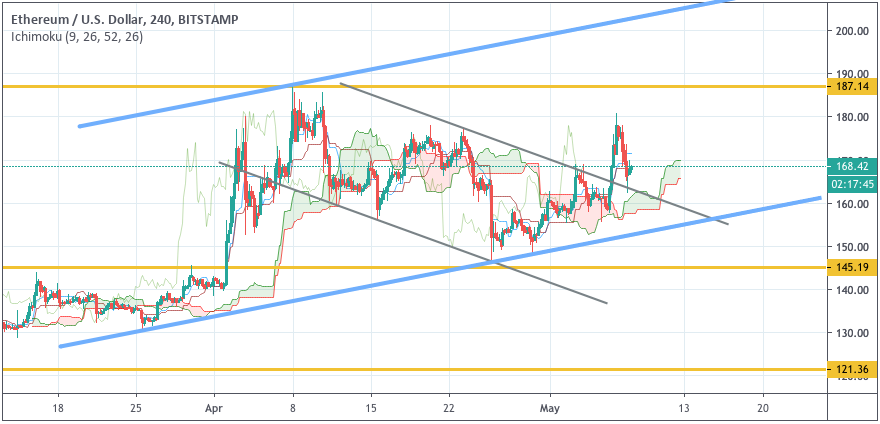
On H1, ETH is also trading above the Ichimoku and may rise to $190 after bouncing up.
If $190 gets broken out, price will then continue rising to the upper channel boundary.
Conversely, in case the bottom cloud area gets broken out and price closes below $150, then ETH may break out the lower ascending channel boundary and plunge to $120.
Litecoin
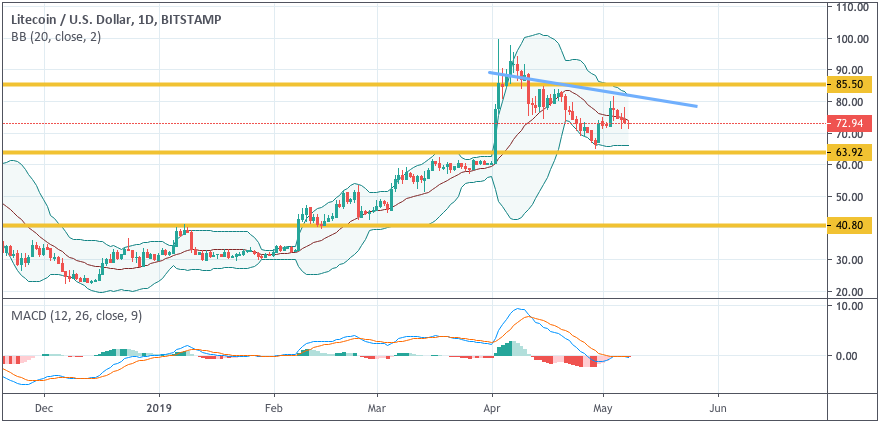
LTC is still correcting down, while the uptrend may resume soon. The middle Bollinger band is being tested, which shows a reversal may be quite near.
LTC is currently trading around $72.94. On D1, it may plunge to $70, only to continue rising afterwards, which is confirmed with the inverted head and shoulders pattern, where the right shoulder has been nearly formed.
Another confirmation may be issued by the price breaking out the upper Bollinger band at $85, in which case LTC may hit $100. Conversely, if the price chooses to go down, it may hit the support and close below $64.
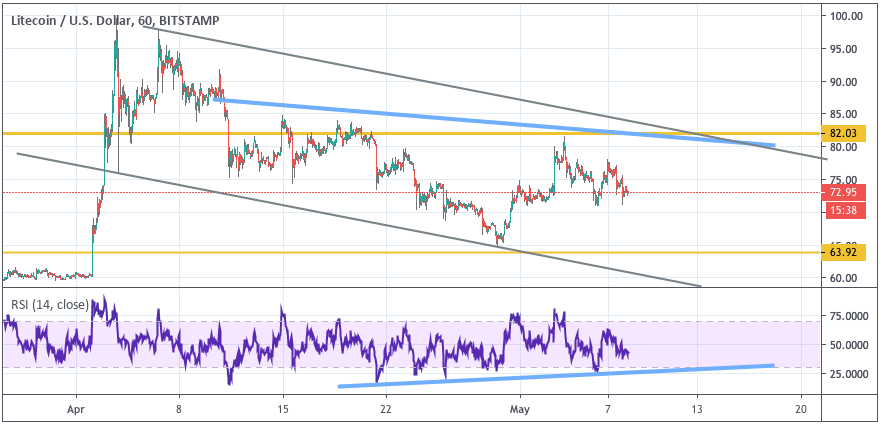
The H1 chart also shows the pattern has been nearly formed, with the price ready to reverse. eval(ez_write_tag([[468,60],'trustnodes_com-large-leaderboard-2','ezslot_2',177,'0']));
LTC has a few times bounced off RSI support, thus confirming a short term upward move, which is going to happen in case the upper channel boundary gets broken out and the crypto closes above $83. Conversely, the price will get down after the support at $64 gets hit.
Bitcoin Cash
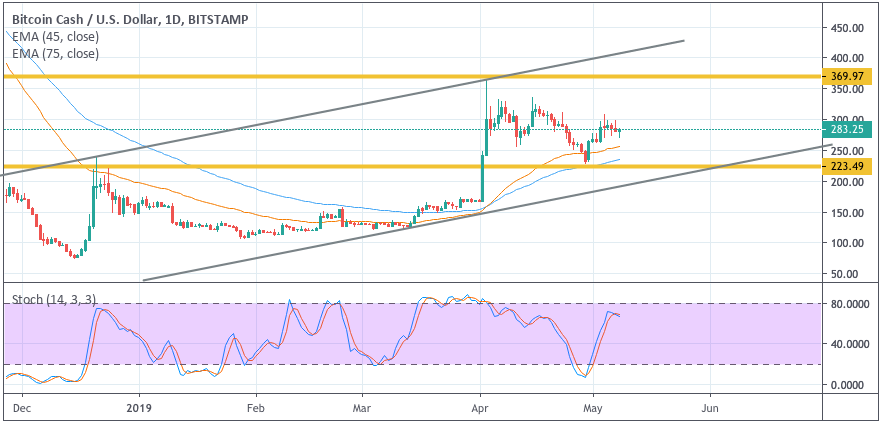
BCH bounced off the support at $225, still moving along an ascending channel. The price is above the MA’s, which means the upmove is quite stable.
When testing the support, BCH also tested the MA area, which again confirms the rise, ready to take the price to $370.
The Stochastic lines crossover, meanwhile, signals a pullback, which is unlikely to change the whole thing, though, especially if the local high at $305 finally gets broken out.
Conversely, if $200 is broken out and the price stays below, the outlook will turn bearish.
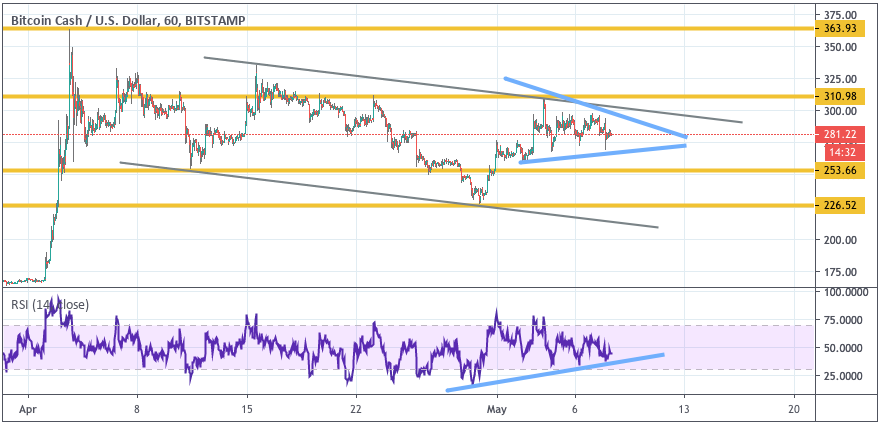
On H1, BCH is moving along a triangle, which shows uncertainty; in case either boundary gets broken out, the volatility is sure to increase.
Most likely, the lower boundary will get tested, after which the price will first bounce and then continue rising, especially if it succeeds in breaking out the upper local descending channel boundary and closing above $310, which will probably take it to $345.
However, BCH may also hit the lower boundary and stay below $255, which then may take it to the next support at $225.
The weekly Crypto Technical Analysis is provided by Dmitriy Gurkovskiy, Chief Analyst at RoboForex.
Needless to say, all statements and views expressed above and any forecasts contained herein are solely based on the author’s particular opinion.
This analysis may not be treated as trading advice. RoboForex and Trustnodes bears no responsibility for trading results based on trading recommendations and reviews contained herein.
Copyrights Trustnodes.com


Article comments