Tron [TRX/USD] Technical Analysis: Bear looms over coin as impending doom nears
![Tron [TRX/USD] Technical Analysis: Bear looms over coin as impending doom nears](https://coinhub.news/img/10/10d1f89ed3e7d4cebae2d21355fca6fd_730_522.webp)
Since the past few weeks, the cryptocurrency market showed signs of recovery from the bear’s barbarity, with a majority of coins recovering faster than the rest as they rose up in double digits. One of the coins was Tron [TRX], the tenth-largest cryptocurrency by market cap. Nevertheless, the coin could face the bear’s wrath again in the market this new year.
According to CoinMarketCap, at press time, Tron was trading at $0.0198, with a market cap of $1.32 billion. The cryptocurrency showed a trading volume of $97.23 million.
1-hour
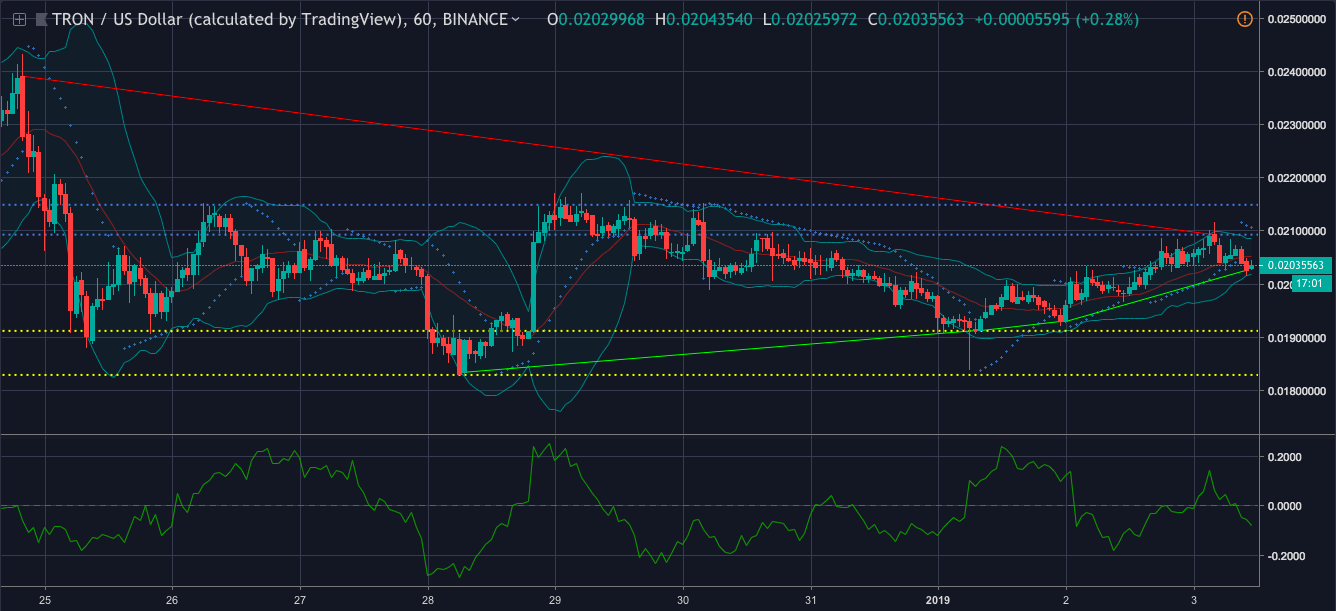
The one-hour chart demonstrates a downtrend starting from $0.0239 and ending at $0.0209. The cryptocurrency recorded multiple uptrends, with the first set from $0.o183 to $0.0191, and the last pictured from $0.0192 to $0.0202. The immediate resistance for the coin is set at $0.0209 and the strong resistance is at $0.02149. The immediate support can be found at $0.0191 and the strong support ground at $0.0182.
The Parabolic SAR is indicating a strong bearish presence as the dots have aligned on top of the candlesticks.
Chaikin Money Flow is also on the same page as it is showing that the money is flowing out of the market.
Bollinger Bands is forecasting a less volatile market as the bands are closing in on each other.
1-day
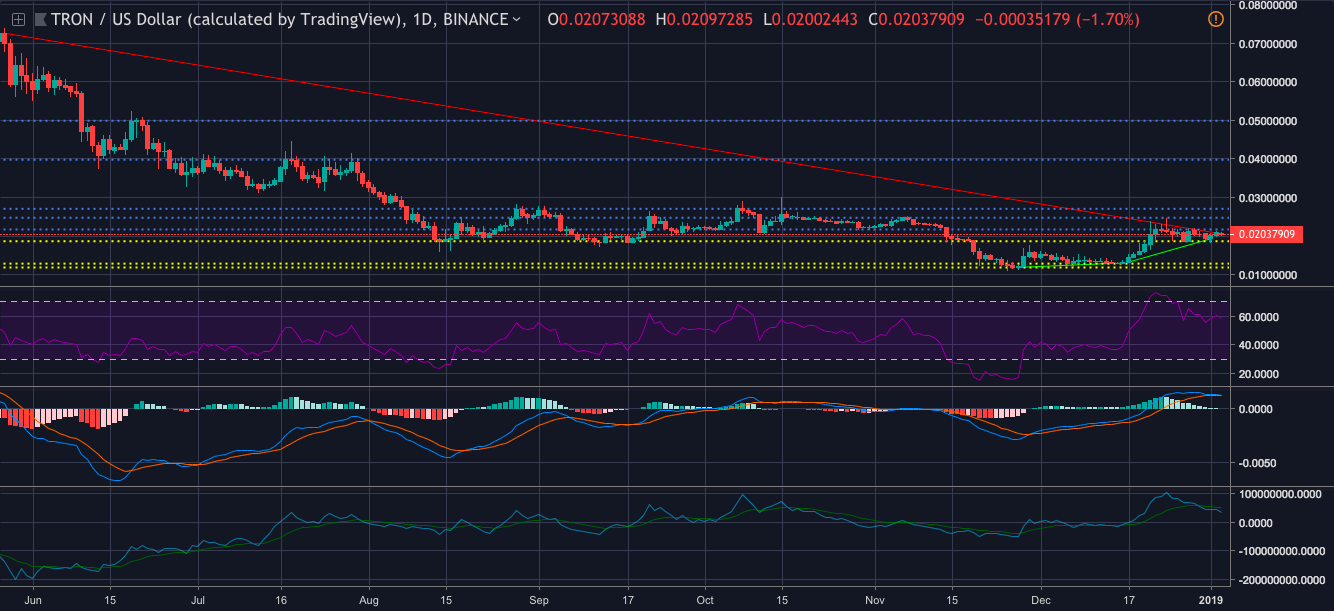
In the one-day chart, the coin shows a downtrend from $0.0725 to $0.0208. On the other side, the uptrend is marked from $0.0119 to $0.0129. The chart also records another upward movement from $0.0132 to $0.0193. The immediate resistance for the cryptocurrency is at $0.0217 and the strong resistance is at $0.0498. The coin is going to be supported first at $0.0186 and then at the $0.0118 ground.
Klinger Oscillator is already showing a bearish market as the reading line has made a crossover only to seek shelter in the rabbit hole.
MACD is currently trying to hold the bull back in the market. However, the moving average line is forecasting a crossover.
RSI is showing that the buying pressure and the selling pressure for the cryptocurrency are currently evened out in the market.
Conclusion
The cryptocurrency’s good days in the market seems to be nearing its end as the indicators are showing the bear’s return to the market. They are Klinger Oscillator from the one-day chart, Chaikin Money flow and Parabolic SAR from the one-hour chart.


Article comments