This Indicator Is Still Adamant Chainlink (LINK) Is Poised to Drop Further
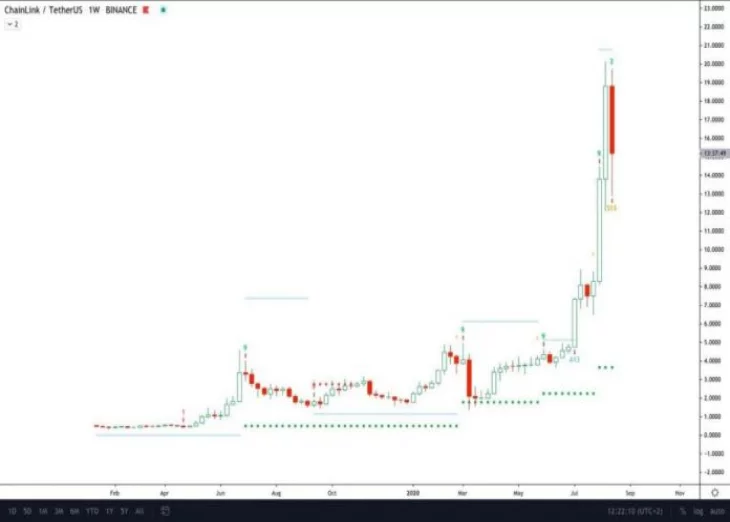
The Tom Demark Sequential suggests that LINK has further to fall. According to a Telegram channel tracking Tom Demark Sequential signals, Chainlink has formed a “Sell S-13” on its weekly chart against the dollar.
- Chainlink surged on Saturday after plunging around 25% from its local highs near $20.
- The asset reached approximately $16, bouncing from the $14 lows.
- LINK is down on Sunday, trading 5.5% lower in the past 24 hours.
- A crucial technical indicator that has been calling for a Chainlink correction for days and weeks recently confirmed a bearish signal again.
- The signal suggests LINK will continue to drop from here, potentially back into single-digit prices.
The Tom Demark Sequential forms “9” and “13” candles when an asset is at an inflection point in its trend.
Chainlink is likely to experience a multi-week correction should the indicator’s accuracy for the asset continue.
As can be seen in the chart above, the Tom Demark Sequential has had immense accuracy in predicting LINK’s price action on a weekly time frame.
Sequential “9” candles marked three separate local highs in the price of the cryptocurrency over the past two years: once in June 2019, once in February 2020, and once when LINK reached an interim top in the middle of May.
Technical analysts agree with the bearish sentiment implied by the Tom Demark Sequential’s formation of a “Sell S-13” candle for Chainlink.
One crypto analyst recently remarked that a pullback for Chainlink to $13 will likely soon arrive due to a break in the local trend:
“This is a very unbiased & non-marine opinion on LINK. I have no business FUDing the project nor do I need to support it in a culty way. Facts are that we had a HUGE run-up and are now pulling back, which is good. I do see more blood coming though. Simple TA shows that we have no supports tested on the daily. Our first “bigger support” is around $8.50 (0.618 Fib Level). The minimum pull-back I am expecting is to $13.00 We also broke the daily trend for Chainlink.”
Bitcoinist analyst Tony Spiltoro also recently found that Chainlink’s on-balance volume indicator recently broke below a multi-month uptrend. The indicator tries to observe price action in relation to market volumes in a bid to determine trends.
TheBitcoinNews.com is here for you 24/7 to keep you informed on everything crypto. Like what we do? Tip us some BATSend Tip now!


Article comments