Bitcoin Is Printing a Textbook Bearish Reversal Pattern: $9,000s in Play

One trader recently noted that BTC’s chart since the end of July looks almost identical to a schematic depicted by legendary technical analyst Richard Wyckoff.
- Bitcoin’s recent rally has seemingly been bullish, bringing the asset above $10,500, then $11,500.
- As of this article’s writing, the cryptocurrency trades for $11,500.
- BTC may actually be trading in a textbook top pattern, though.
- The pattern identified by a trader predicts Bitcoin will reverse to the $10,000s, then lower towards the $9,000s.
- This may not be a macro bearish pattern though.
- Analysts say that Bitcoin retracing 30-40% during bull cycles is an entirely normal trend.
- In the 2016-2017 bull market, BTC saw a number of strong pullbacks, especially during the period of China FUD.
As the chart below shows, BTC’s price action looks like Wyckoff’s distribution schematic #1. The schematic lines up with an asset’s price action when it is near a local or medium-term top.
Bitcoin following the schematic to a T from here will mean that it will soon extend towards the $10,000s, then likely lower to pre-rally levels. This may mean that by the middle of September, BTC trades in the mid-$9,000s once again.
The expectations of a price correction towards $9,000s aren’t exactly unfounded.
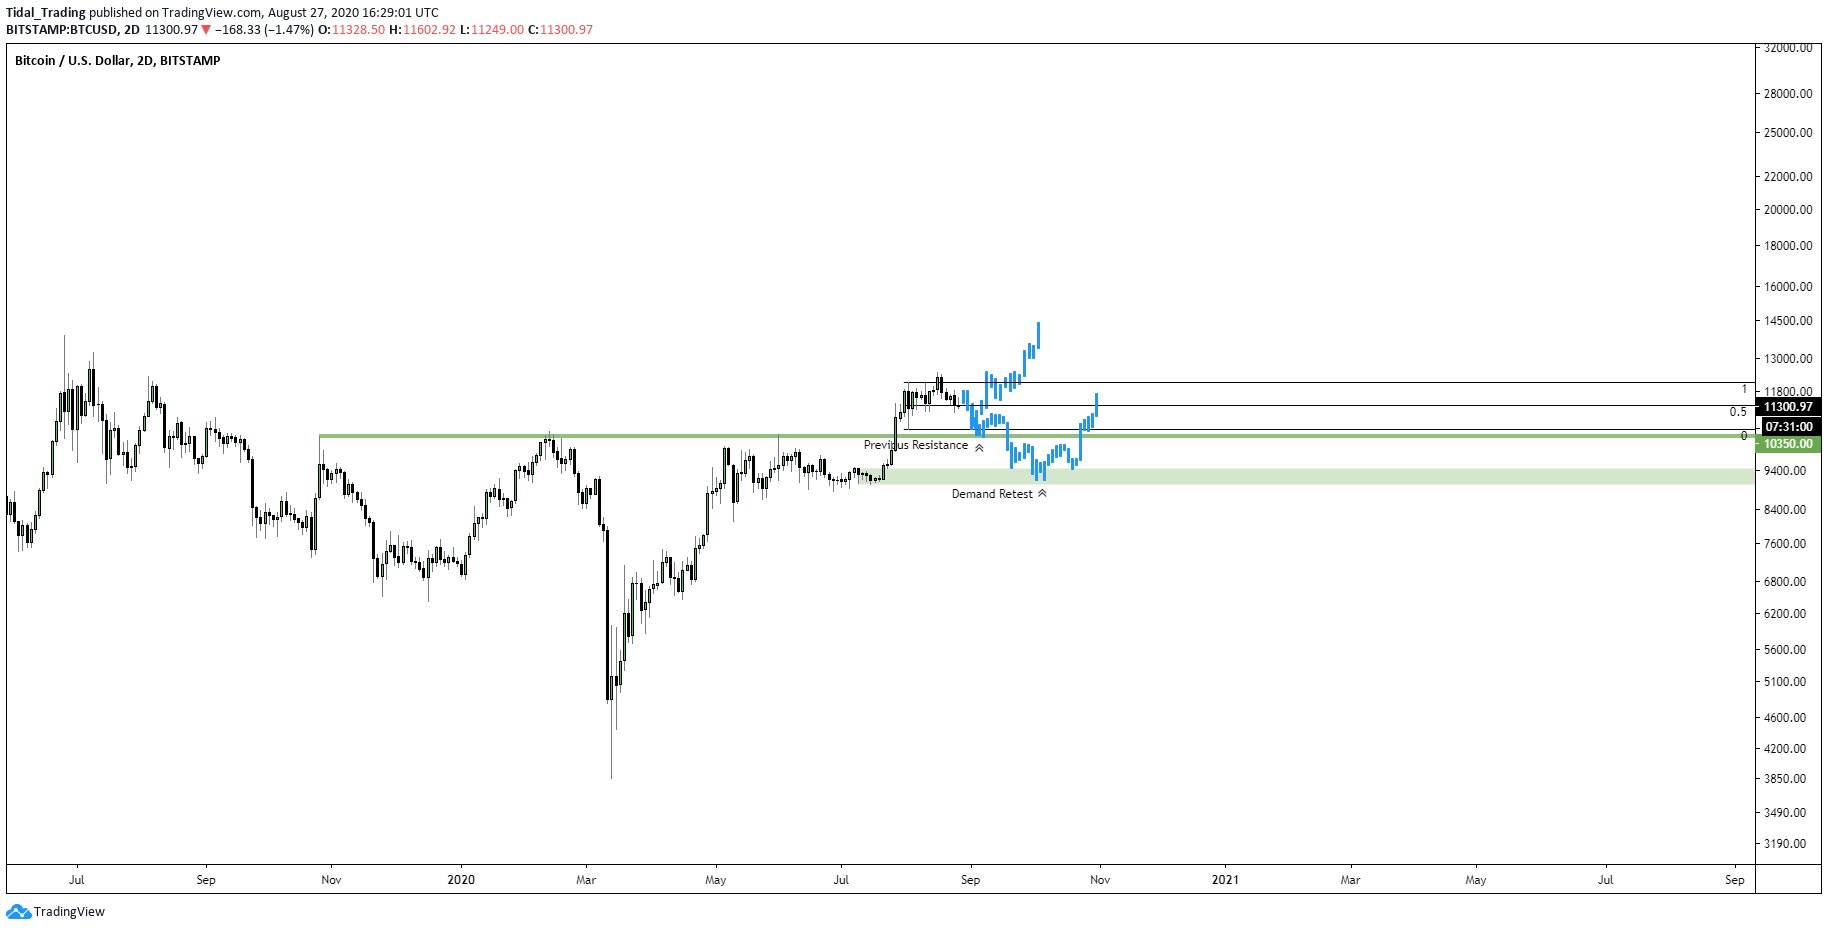
As reported by Bitcoinist previously, one trader noted that Bitcoin dropping to the $9,000s would satisfy BTC’s historical tendency to fall 30-40% during bull markets. Referencing the chart seen below, the trader who shared this sentiment remarked:
“$BTC #Bitcoin High Time Frame plan: Buy the previous resistance and if that fails buy the daily demand retest (see 2016-2017 corrections),” the analyst wrote in regards to BTC’s potential to retest the $9,000s before another leg higher.
Bitcoin is anything but bearish in the longer run, though.
The Winklevoss Twins of Gemini recently asserted that Bitcoin is poised to rally exponentially in the long run due to impending inflation:
“Inflation is coming. Money stored in a bank will get run over. Money invested in assets like real estate or the stock market will keep pace. Money stored in gold or bitcoin will outrun the scourge. And money stored in bitcoin will run the fastest, overtaking gold.”
They said that BTC could hit $500,000 in the longer run, which would put the asset’s market cap over that of gold.
TheBitcoinNews.com is here for you 24/7 to keep you informed on everything crypto. Like what we do? Tip us some BATSend Tip now!


Article comments