XRP Price Prediction: XRP Is Trading Inside a Symmetrical Triangle, When Will the Breakdown/Out Occur?
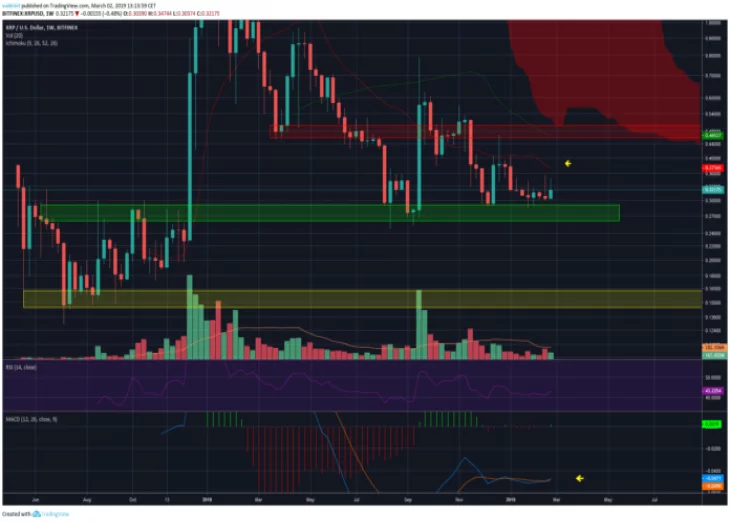
A look at the Weekly chart for XRP shows that price is trading at $0.32, slightly above the major support area near $0.27.
The previous week’s candle had a large upper wick, indicating that sellers have the upper hand.
However, this week we have had a bullish hammer candle.
Price is trading below the 21 and 50-period moving averages, the former providing very close resistance to the price.
Price is also trading below the Ichimoku cloud. The most significant resistance area is found near $0.45.
The RSI is at 43, indicating neither overbought nor oversold conditions.
On a more positive note, the MACD has made a bullish cross and has started to move upward.
A look at the 3-day chart shows that price has been following a descending resistance line which has been in place since September 2018.
Price has had four unsuccessful attempts at breaking out above but has been pushed back in every instance.
The 21 and 50-period moving averages have made a bearish cross, and the former is providing very close resistance to the price.
On a more positive note, there is some bullish divergence in the RSI, and the MACD is moving upward but is not positive yet.
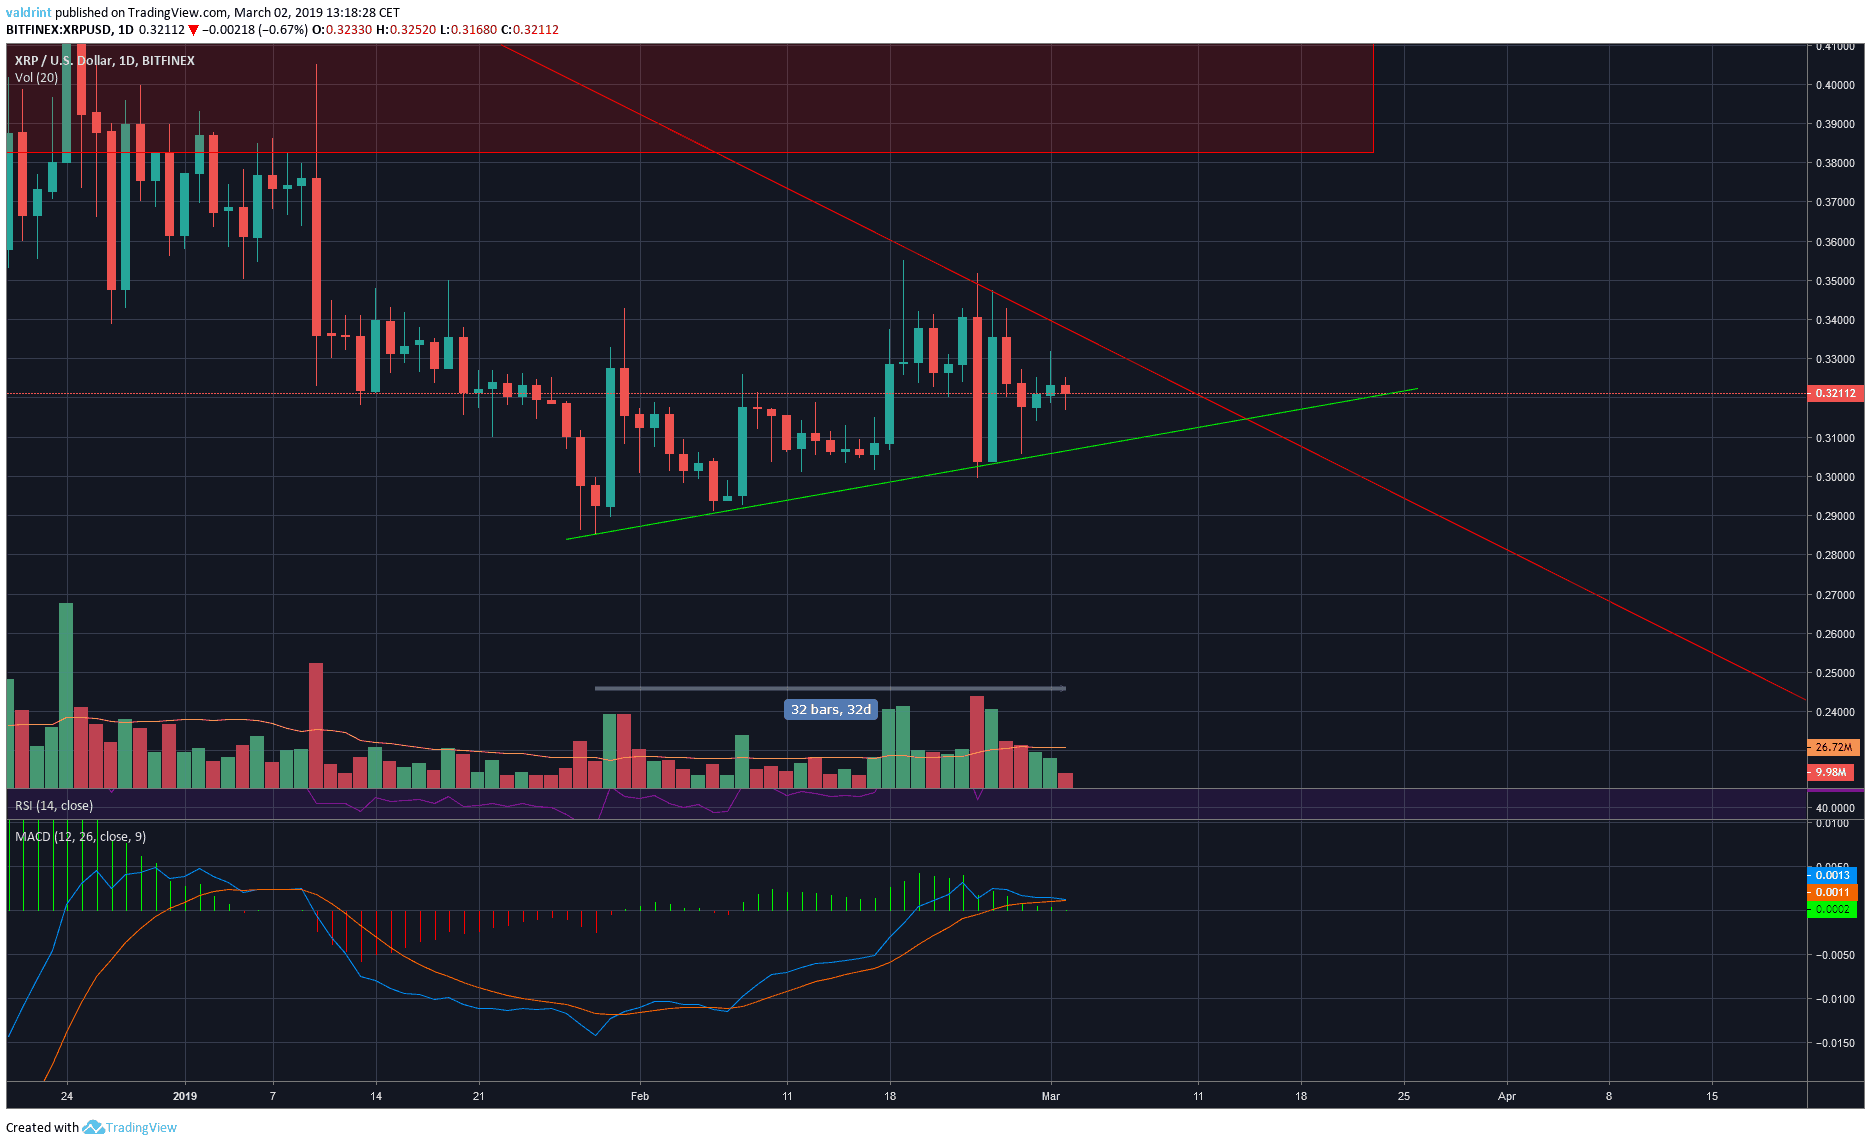
A look at the Daily chart shows that price has been following an ascending support line for the past 32 days, forming a symmetrical triangle combined with the resistance from the previous chart.
The MACD has made a bearish cross but has not turned negative yet. The triangle is predicted to end in 6 days.
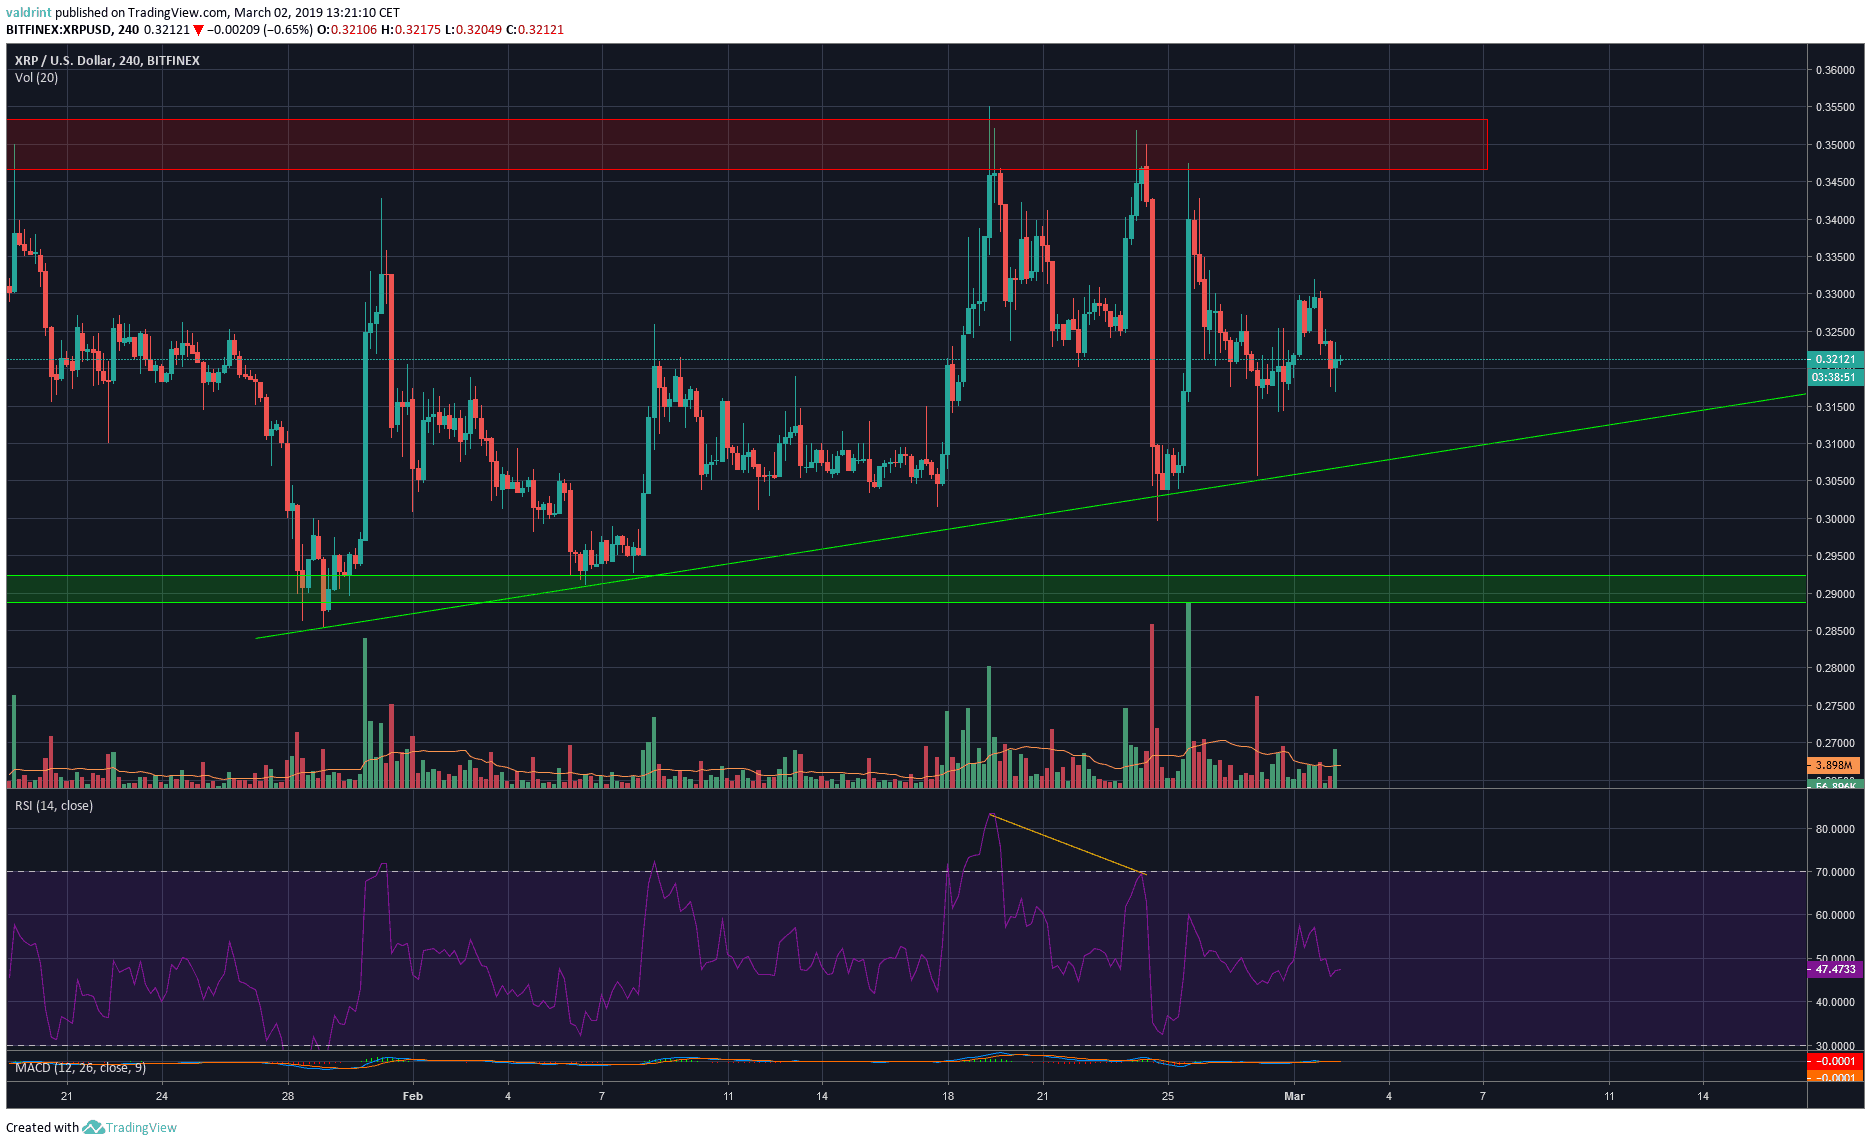
A look at the 4-hour chart shows that after reaching $0.35, the price made a double top pattern combined with bearish divergence, which dropped it all the way to the support line near $0.3.
Price is currently trading at $0.32. A break below the support line would put the double bottom scenario near $0.29 into play.
Price Prediction: I believe that during this week there will be minimal movement in price, which will fall back to the support line near $0.3.
- Price is trading below the long-term moving averages.
- Price has been trading inside a symmetrical triangle for the past 32 days.
- The drop was preceded by short-term bearish divergence.


Article comments