Ethereum Price Weekly Analysis: ETH Breaks $125, Could Test $140

Key Highlights
Ethereum price gained a lot of bids versus the US Dollar and Bitcoin. ETH/USD broke the $125 resistance and it may now climb towards the $140 level.
Ethereum Price Analysis
This past week, ETH price followed a solid bullish formation from the $96 swing low against the US Dollar. The ETH/USD pair traded above the $100 and $110 resistance levels. There was even a proper close above the $110 level and the 100 simple moving average (4-hours). An intermediate high was formed at $117 before the price corrected lower. However, losses were protected near the $105-106 zone and the price bounce back later.
It broke the $115 and $125 resistance levels to trade to a new weekly high above $128. The price is currently in a solid uptrend above the $115 and $12 level. An initial support is the 23.6% Fib retracement level of the recent wave from the $105 low to $129 high. Moreover, there is a major bullish trend line formed with support at $114 on the 4-hours chart of ETH/USD. The 50% Fib retracement level of the recent wave from the $105 low to $129 high is also at $117. Therefore, there are many support, starting with $124, and up to $114.
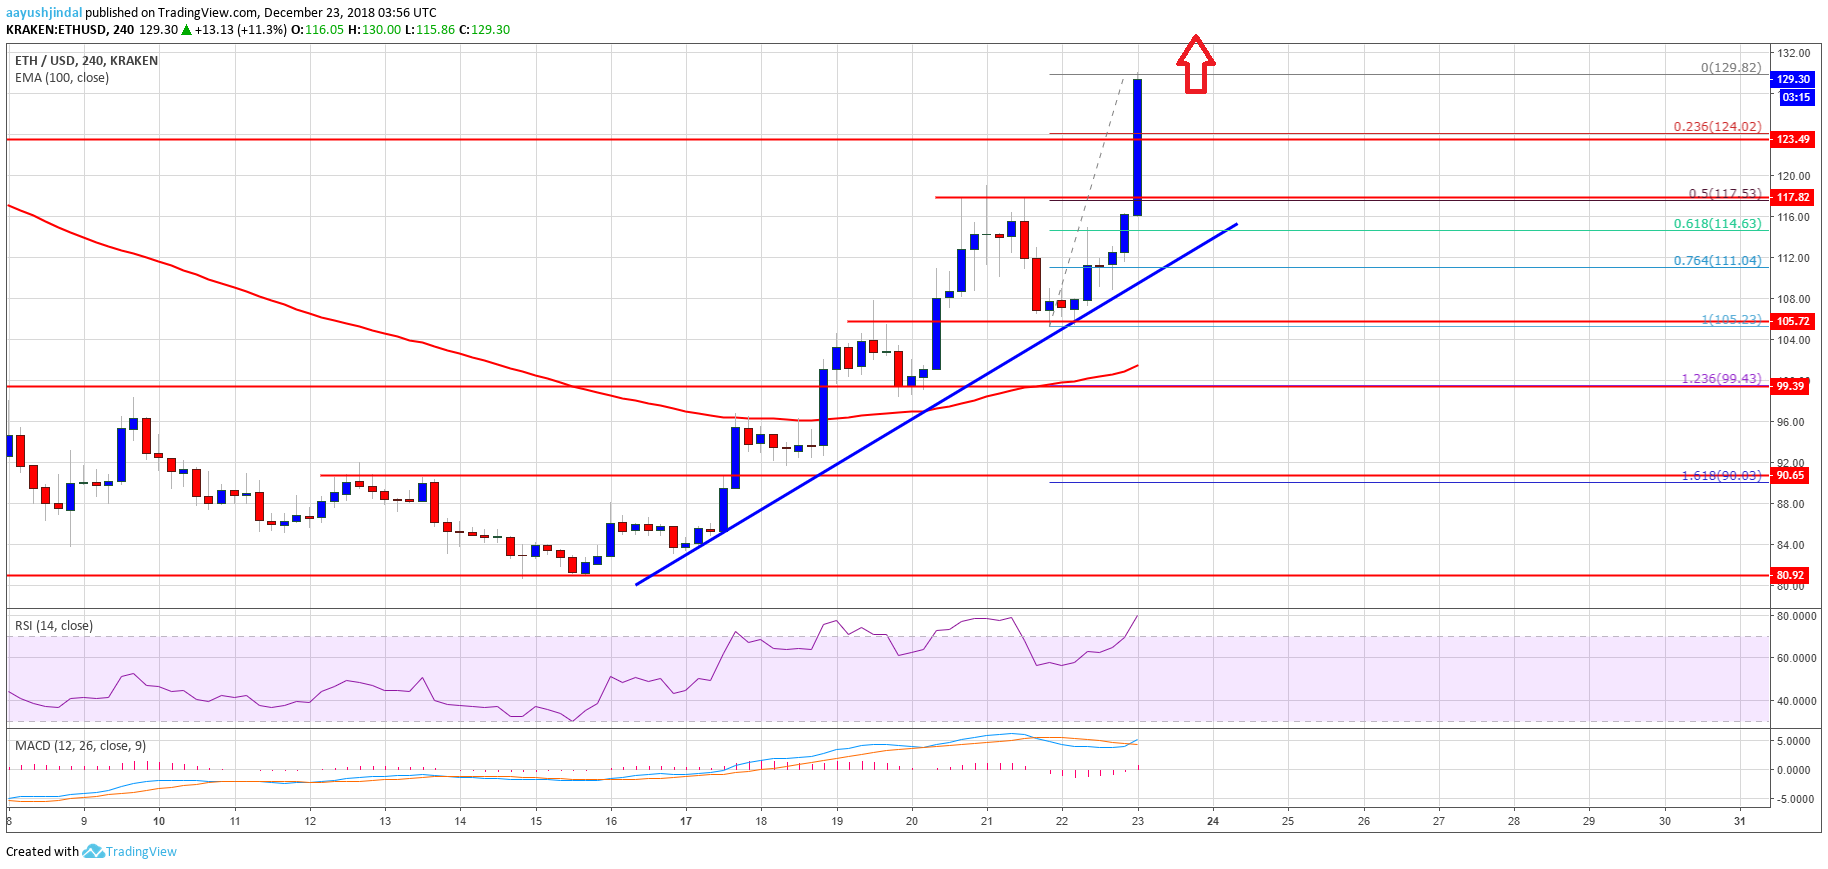
The above chart indicates that ETH price is placed nicely above the $114-115 zone. Buyers remain in control and they are likely to push the price towards the $135 or $140 level.
4-hours MACD – The MACD is gaining momentum in the bullish zone.
4-hours RSI – The RSI recently jumped above the 70 level.
Major Support Level – $115
Major Resistance Level – $135


Article comments