Ethereum Price Analysis: ETH/USD’s Massive Breakdown Below $100

Key Highlights
Ethereum price is facing heavy selling pressure against the US Dollar and bitcoin. ETH/USD is likely to decline further as long as it is below $106 and $110.
Ethereum Price Analysis
Yesterday, we discussed that ETH price could test the $100 level against the US Dollar. The ETH/USD pair did trade below the $110 and $105 support levels to enter a bearish zone. There was even a close below the $105 level and the 100 hourly simple moving average. The price traded close to the $100 level and it seems like it could continue to move down. The recent low was $100 and the next immediate support is at $98.
On the upside, an initial resistance is the 23.6% Fib retracement level of the recent decline from the $112 high to $100 low. Above $103, there is a crucial bearish trend line in place with resistance at $106 on the hourly chart of ETH/USD. The trend line resistance near $105-106 is significant since it was a support earlier. Besides, the 50% Fib retracement level of the recent decline from the $112 high to $100 low is near $105. Therefore, if the price corrects highs, it could face a strong barrier near the $105 and $106 levels.
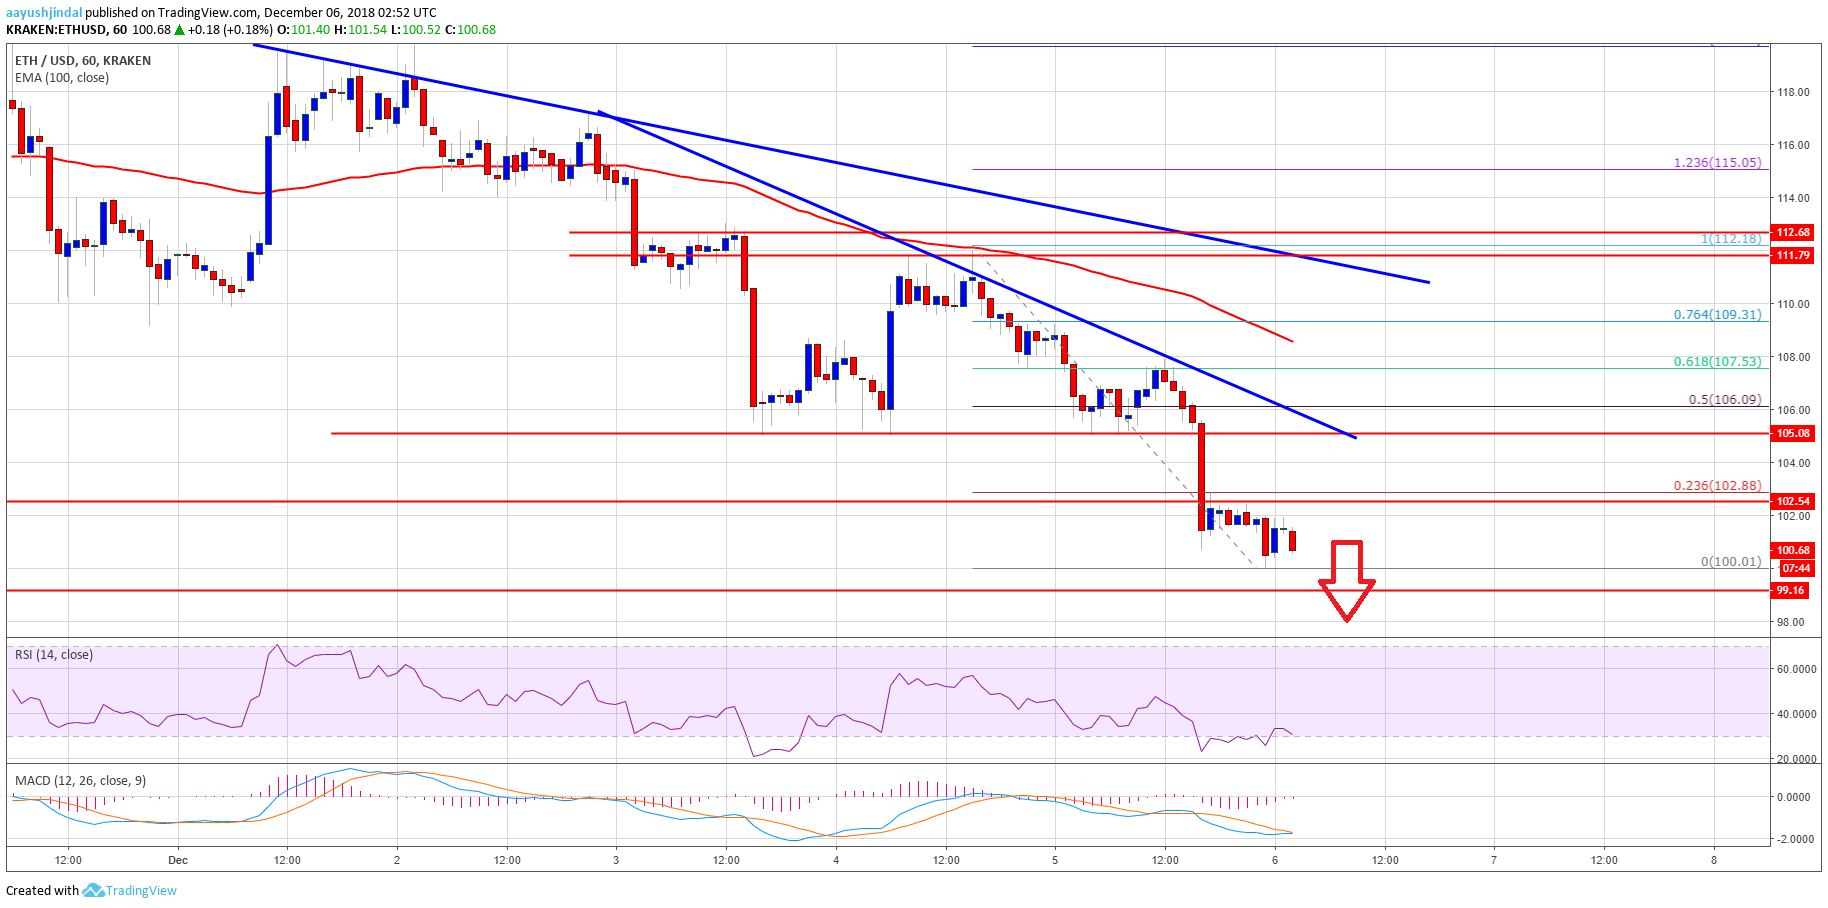
Looking at the chart, ETH price is clearly under pressure below $105. It is likely to break the $100 and $95 levels to set the pace for more losses in the near term.
Hourly MACD – The MACD is slowly moving back in the bullish zone.
Hourly RSI – The RSI is currently positioned well below the 40 level.
Major Support Level – $95
Major Resistance Level – $106


Article comments