Bitcoin Price Will Hit $6,500-Mark in Near-Term: Veteran Commodity Trader

Bitcoin could undergo an immediate bearish correction, but it would eventually bounce back towards $6,500, according to Peter Brandt.
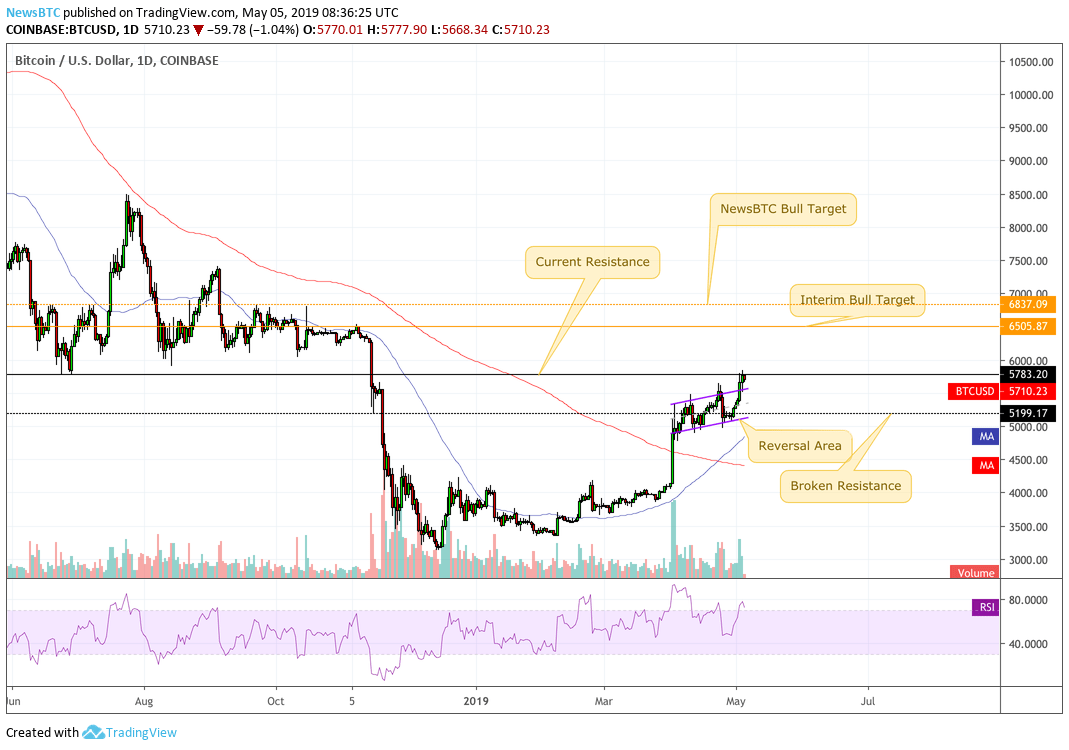
The veteran commodity trader said Saturday that the bitcoin price was meeting its crucial resistance level near $5,745, as shown in the chart below. There was a strong probability of the asset undergoing a reversal, which loosely means that traders were not confident to purchase bitcoin at its higher rate. Therefore, the ones who bought the asset near $5,000-support might want to exit their positions on a handsome $745-per-bitcoin profit – more or less.

However, that does not mean that bitcoin’s ongoing uptrend could end. Brandt said the asset could move towards $6,500 as traders repurchase it near the fresh session lows. He stated:
“There is a chance is topping here, having met its price target at key resistance. A correction could occur before another move toward 6500, then a more significant correction.”
Just an opinion — there is a chance $BTC is topping here, having met its price target at key resistance. A correction could occur before another move toward 6500, then a more significant correction. pic.twitter.com/woetnihqB5 — Peter Brandt (@PeterLBrandt) May 4, 2019
Breaking Down the Bitcoin Prediction
Two key components serve the basis of Brandt’s $6,500 price prediction for bitcoin. NewsBTC has simplified them as shown in the chart below. We have also added our bull target to keep the discussion going.
Current Resistance
Bitcoin has confirmed a breakout above its bull flag formation (orchid) and is now testing $5,783 as its near-term resistance level. Brandt has highlighted the area for its historical significance. One can notice the black horizontal line in the chart above acting as a critical support level to the bitcoin’s downside action. In July 2018, the asset briefly pulled back from $5,783 to initiate a bull run that would eventually settle towards $8,500. And now, the level is back in view as bitcoin’s price target – this time to the upside.
If the asset breaks above it, accompanied by a rise in volume, then its’ likelihood of reaching $6,000 will become higher. The psychological resistance, if broken, could further push the price towards $6,500, at least according to Peter Brandt.
Reversal Area
A reversal area is merely a risk assessment tool, if we are interpreting Brandt’s prediction rightly. Indeed, the bitcoin’s daily Relative Strength Index is oversold (it is now above 70). That means the asset could go a natural bearish correction anytime. If it does, the price could fall towards a substantial support area defined by the lower trendline of the bearish flag (orchid) and a support level from November 15, 2018’s downside action (dotted black, $5,196-5,199).
The support area could see a fair amount of accumulation, leading to a bounce back towards $5,783, the near-term resistance. The move will bring the market back to the breakout scenario as discussed in the ‘Current Resistance’ section above.
Beyond $6,500
Brandt’s $6,500 bull target for bitcoin comes in the wake of the level’s significance during the October-November trading session. Nevertheless, one should also keep an eye open towards $6,837, another upside target for super medium-term bulls. The horizontal dotted saffron line has been tested a total of fifteen times in the past twelve months as resistance. It stood well on eleven occasions, which makes it a far stronger pullback level than $6,500.
It’s food for thought, in the end.


Article comments