Bitcoin Price Weekly Analysis: BTC/USD Remains In Downtrend Below $4,500

Key Points
Bitcoin price is slowly recovering above $4,000 against the US Dollar. However, BTC/USD remains in a downtrend as long as it is below the $4,500 resistance.
Bitcoin Price Analysis
This past week, there was a decent recovery from the $3,500 support area in bitcoin price against the US Dollar. The BTC/USD pair traded higher and broke the $3,750 and $4,000 resistance levels. The upside move was positive above the $4,000 and $4,200 levels. There was even a close below the 23.6% Fib retracement level of the last slide from the $5,697 high to $3,483 low. However, the price struggled to clear the $4,400-4,500 resistance zone.
Moreover, there is a key bearish trend line formed with resistance at $4,320 on the 4-hours chart of the BTC/USD pair. The pair is currently consolidating below the trend line and $4,400. The price must break the $4,400 resistance and the 100 simple moving average (4-hours) for more gains. The next major hurdle is near $4,500 and $4,590. The $4,590 level coincides with the 50% Fib retracement level of the last slide from the $5,697 high to $3,483 low. Therefore, a break above the $4,400, $4,500 and $4,590 resistance levels won’t be easy in the near term.
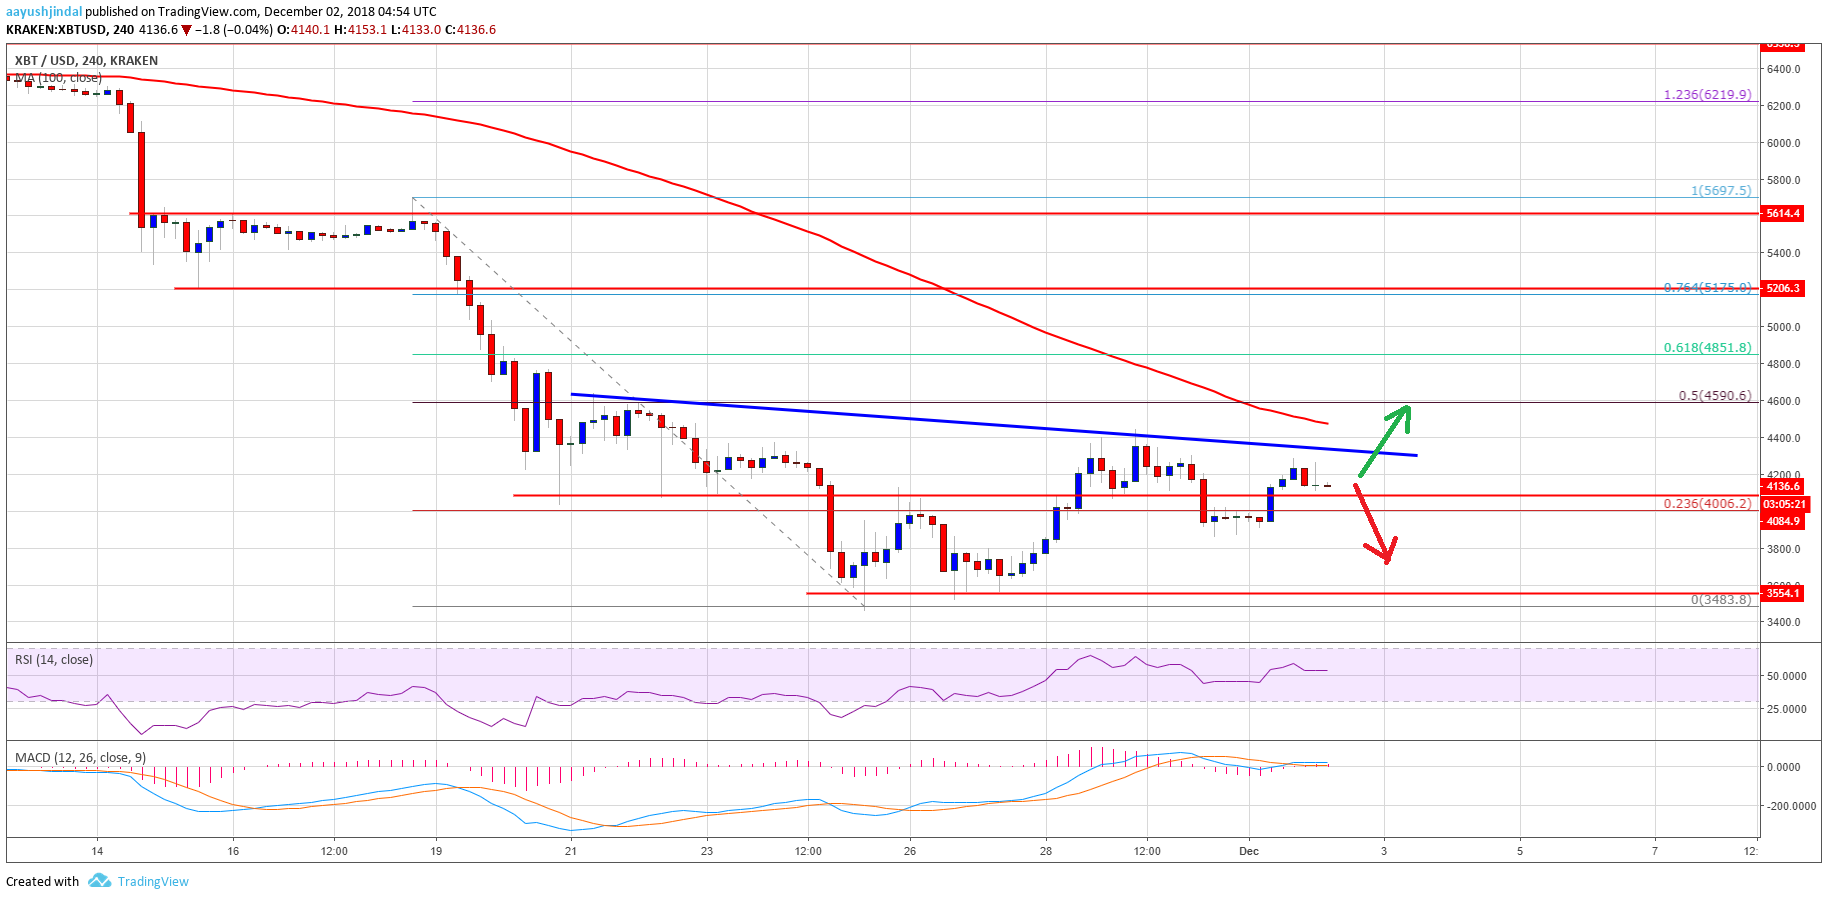
Looking at the chart, BTC price clearly remains in a downtrend as long as it is below $4,500 and the 100 SMA. On the downside, an initial support is at $4,000, below which the price could slide towards $3,600 or $3,500.
Looking at the technical indicators:
4-hours MACD – The MACD for BTC/USD is placed slightly in the bullish zone.
4-hours RSI (Relative Strength Index) – The RSI is currently just above the 50 level.
Major Support Level – $3,600
Major Resistance Level – $4,500


Article comments