Bitcoin Price Watch: BTC/USD Breakdown Looks Like Real Deal

Key Points
Bitcoin price declined heavily towards $5,400 against the US Dollar. BTC/USD may recover a few points, but upsides are likely to be capped by $5,800.
Bitcoin Price Analysis
Yesterday, we discussed a possible sell scenario below $6,350 in bitcoin price against the US Dollar. The BTC/USD pair broke down and nosedived below a few important supports such as $6,150, $6,000 and $5,650. The decline was such that the price traded below $5,400 and formed a new yearly low at $5,336. Later, there was a minor upside correction and the price moved above the $5,500 level.
However, the price seems to be struggling near the $5,600-5,615 zone. Moreover, the 23.6% Fib retracement level of the recent decline from the $6,295 high to $5,336 low is preventing gains. More importantly, there is a short term contracting triangle formed with resistance at $5,600 on the hourly chart of the BTC/USD pair. If there is an upside break above $5,615, the price could test the next major resistance at $5,750-5,600. Besides, the 50% Fib retracement level of the recent decline from the $6,295 high to $5,336 low is near $5,815. Therefore, if there is a recovery, the price is likely to face sellers near $5,615 or $5,815.
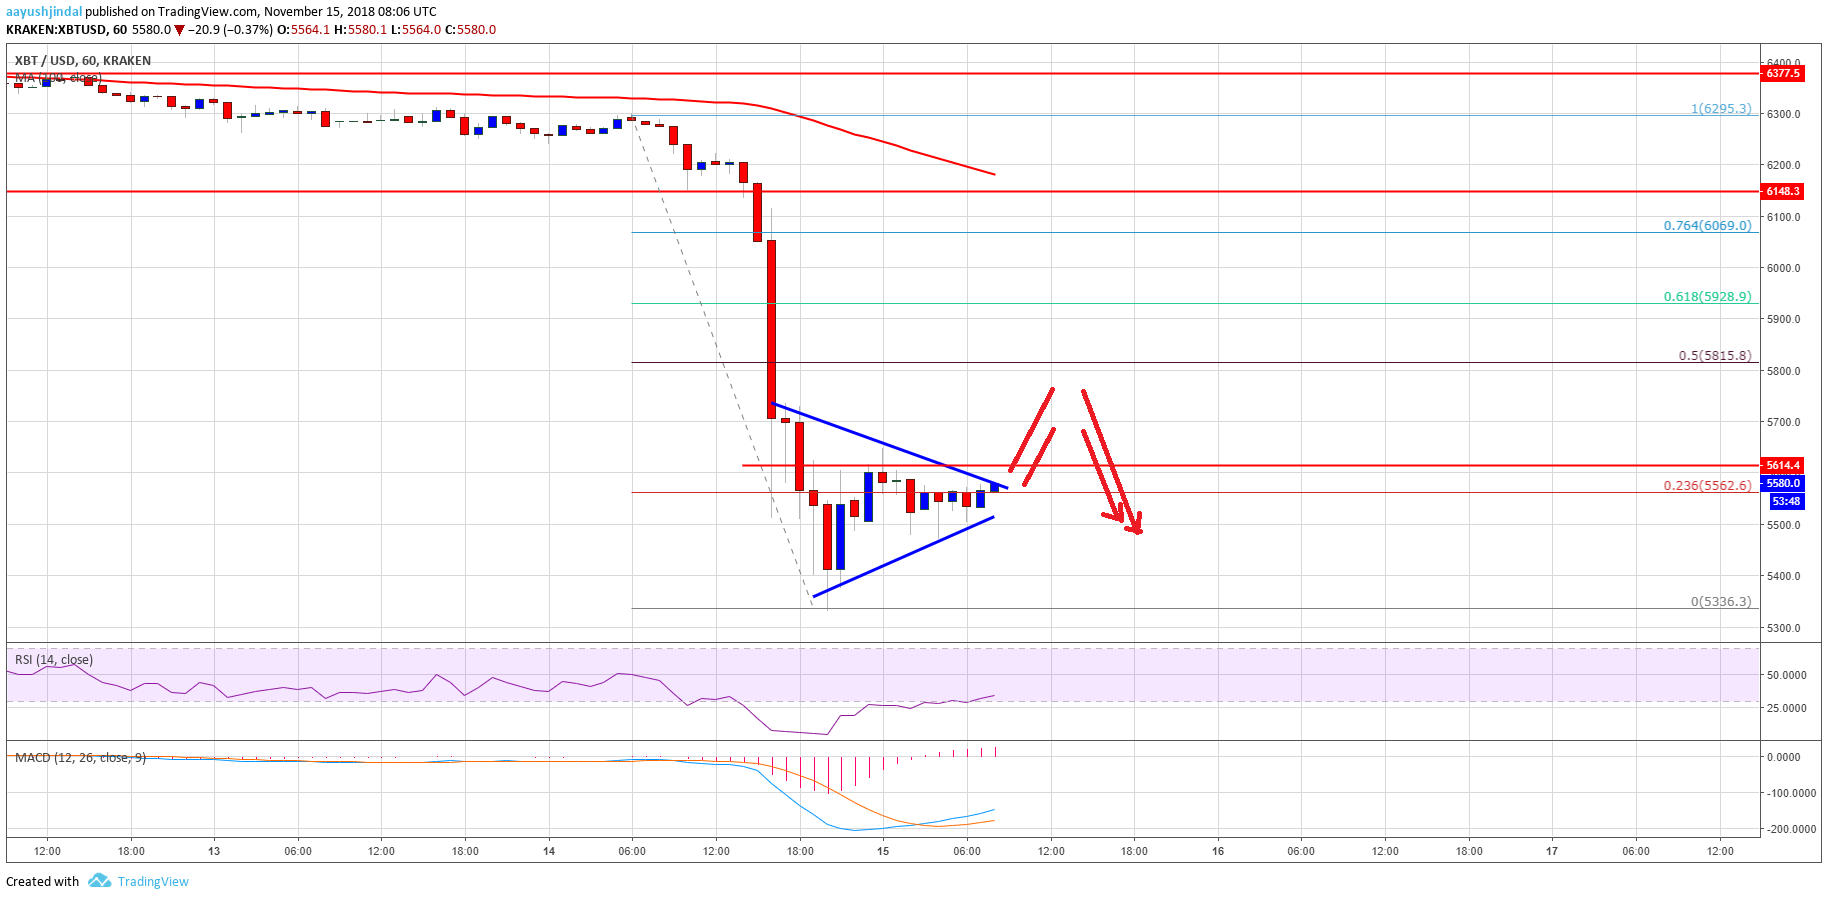
Looking at the chart, bitcoin price decline below $5,800 looks real. There could be more declines below $5,400 after the current correction wave is complete. The main support below $5,400 awaits near $5,100.
Looking at the technical indicators:
Hourly MACD – The MACD for BTC/USD is slowly moving in the bullish zone.
Hourly RSI (Relative Strength Index) – The RSI is currently recovering towards the 40 level.
Major Support Level – $5,400
Major Resistance Level – $5,815


Article comments