Bitcoin Cash (BCH) Technical Analysis: Conflict Between Developers and Miners Impeding Coin’s Value

nChain CEO and self-proclaimed Satoshi Nakamoto, Craig Wright, adds fuel to the ongoing fire between Bitcoin Cash developers and miners ahead of the hard fork in November 2018, with a series of new twitter comments. The current stalemate between Bitcoin ABC, Bitcoin Cash’s largest client and Craig Wright has left the wider Bitcoin Cash community with considerable concerns over the project’s future and longevity. A clear divide between the largest BCH mining pools Coingeek and Bitmain (Antpool + BTC.com) has also added further gravity to the issue.
Understandably, the uncertainty caused by this inside feud has spread across to the wider Bitcoin Cash community, particularly investors who are beginning to doubt the longevity of the hard-forked Bitcoin project. This has led to BCH struggling to break back over $600 in the last 3 weeks, now back below $530 and down -6.38% against USD.

Will BCH be able to survive the inner-conflict between its key supports and developers, or will we see the asset decline further as investor confidence continues to depart? Let’s take a look at the chart.
On the 1D BCH/USD chart, we can see that Bitcoin Cash continues to fall inside an all-encompassing descending triangle pattern, with the asset recently tracking inside the base support region between $600 and $521, over the last three weeks. This is very dangerous territory for BCH to be in at the moment, as the current inner-conflict could easily drive the asset through the base support region and towards new all-year lows.
If this happens, and the first support region fails, then it is likely that we’ll see Bitcoin Cash bears drive the price down further until it finds the next support region below between $406 and $291.
Looking at the indicators over 2hr candles, we can see a number of bearish signals that support this projected price development:
Bitcoin Cash (BCH) Price Targets
All price targets are set from the $521 mark, at the lower support level of the first support region.
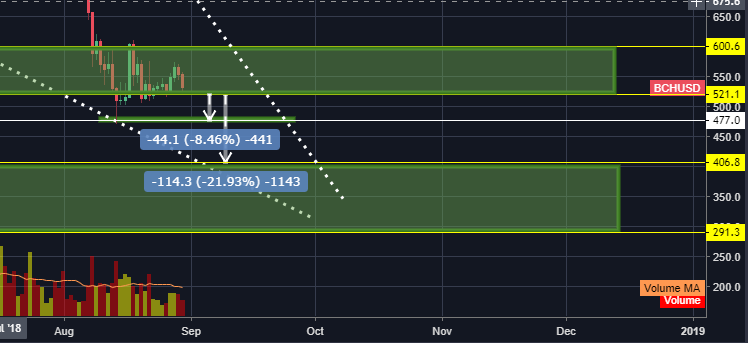
Price Target 1: Bitcoin Cash is likely to find its first foothold at the $477 mark (-8.46%), soon after bears manage to break through the base support level at $521. The $477 mark was a key res/support level historically over November last year.
Price Target 2: From here it is likely that bears will continue to force the price down until it reaches the next main support region below, at $406.80 (-21.93).


Article comments