Ripple XRP Price Analysis Nov.26: After The Correction, Is XRP Following Bitcoin’s Bears?
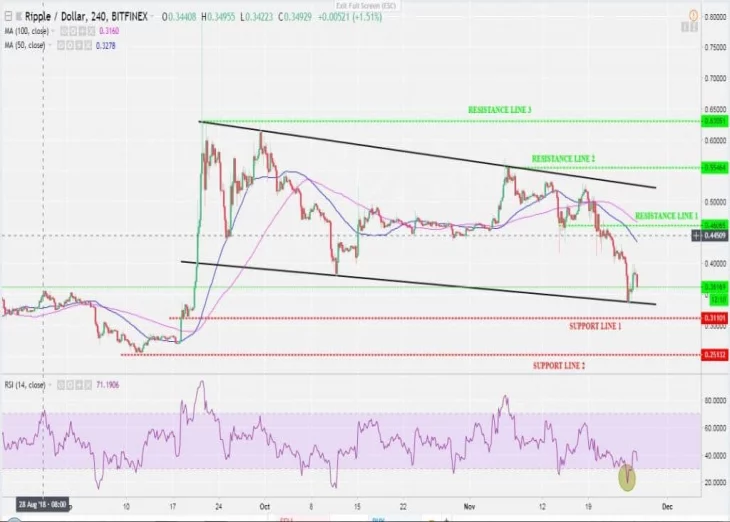
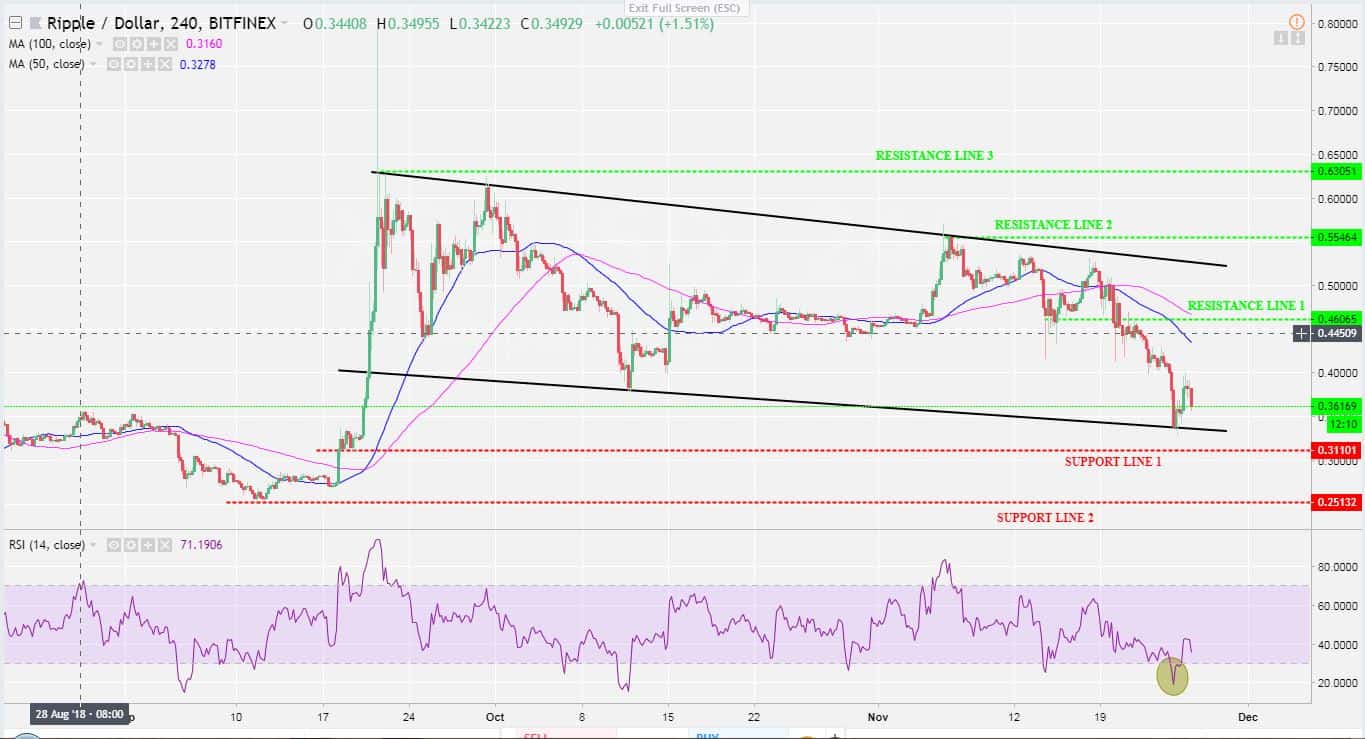
Last week, the Ripple-dollar price recorded a high of $0.53 and a low of $0.33 (reached yesterday). This is mostly due to the enormous Bitcoin sell-off. However, the market is running for a correction that might be ending soon; swinging to revisit the previous resistance levels.
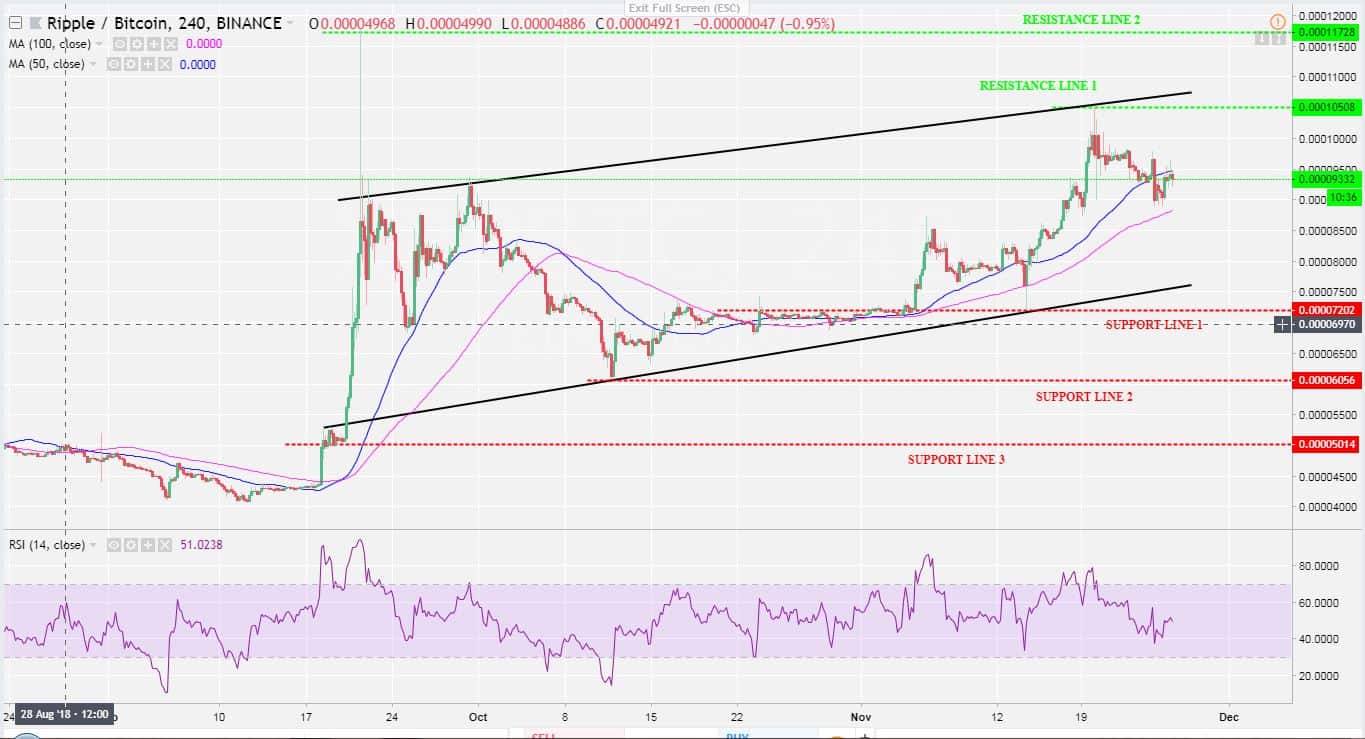
The Ripple-Bitcoin market also saw a significant rise of 10,500 Satoshi before witnessing a drop of 9,000 Satoshi on November 25. Considering Ripple’s pairing: the dollar market sinks in a descending channel pattern, while the Bitcoin price rises in an ascending channel, maybe as a hedge to Bitcoin.
XRP-USD Market
Following the previous analysis, yesterday the $0.38 price level was broken down to a low of $0.33 (sitting on the lower trend line), as of the past hours, the positive correction to the bearish sentiment seems to reach its ending and XRP is facing down again, maybe to re-test the low at $0.33.
The moving average lines (50 and 100) are in a downward position (recently crossed), revealing a sloping trend. The Medium-term outlook of the RSI signifies price is at the low territory of the oversold area (marked in gold on the chart), which might indicate a mid-term reversal.
Resistance: $0.40, $0.46, $0.55, $0.63 | Support: $0.31, $0.25, $0.20
XRP-BTC Market
Reaching the peak of 10,500 SAT price level was mind-blowing for traders and investors last week as XRP experienced a high trading volume ahead of Ethereum on the top market cap coins. Now known as the second crypto, Ripple is still considered the most-traded and largest digital asset after Bitcoin with a notable Market cap.
Looking at the four hours chart, it seems like Ripple is testing previous resistance at 9,400 Satoshi. Failing to break 9400 SAT would be likely to send Ripple to lower support areas: The 100 days moving average line around 8,800 SAT, 8,500 SAT and a strong support level at 8,000 SAT.
Cryptocurrency charts by TradingView. Technical analysis tools by Coinigy.


Article comments