Ripple XRP Price Analysis Jan.2: Signs Indicating On a Sharp Move Ahead

Ripple had recently lost its second place on the top coin market cap list. Except for dignity, it doesn’t mean much.
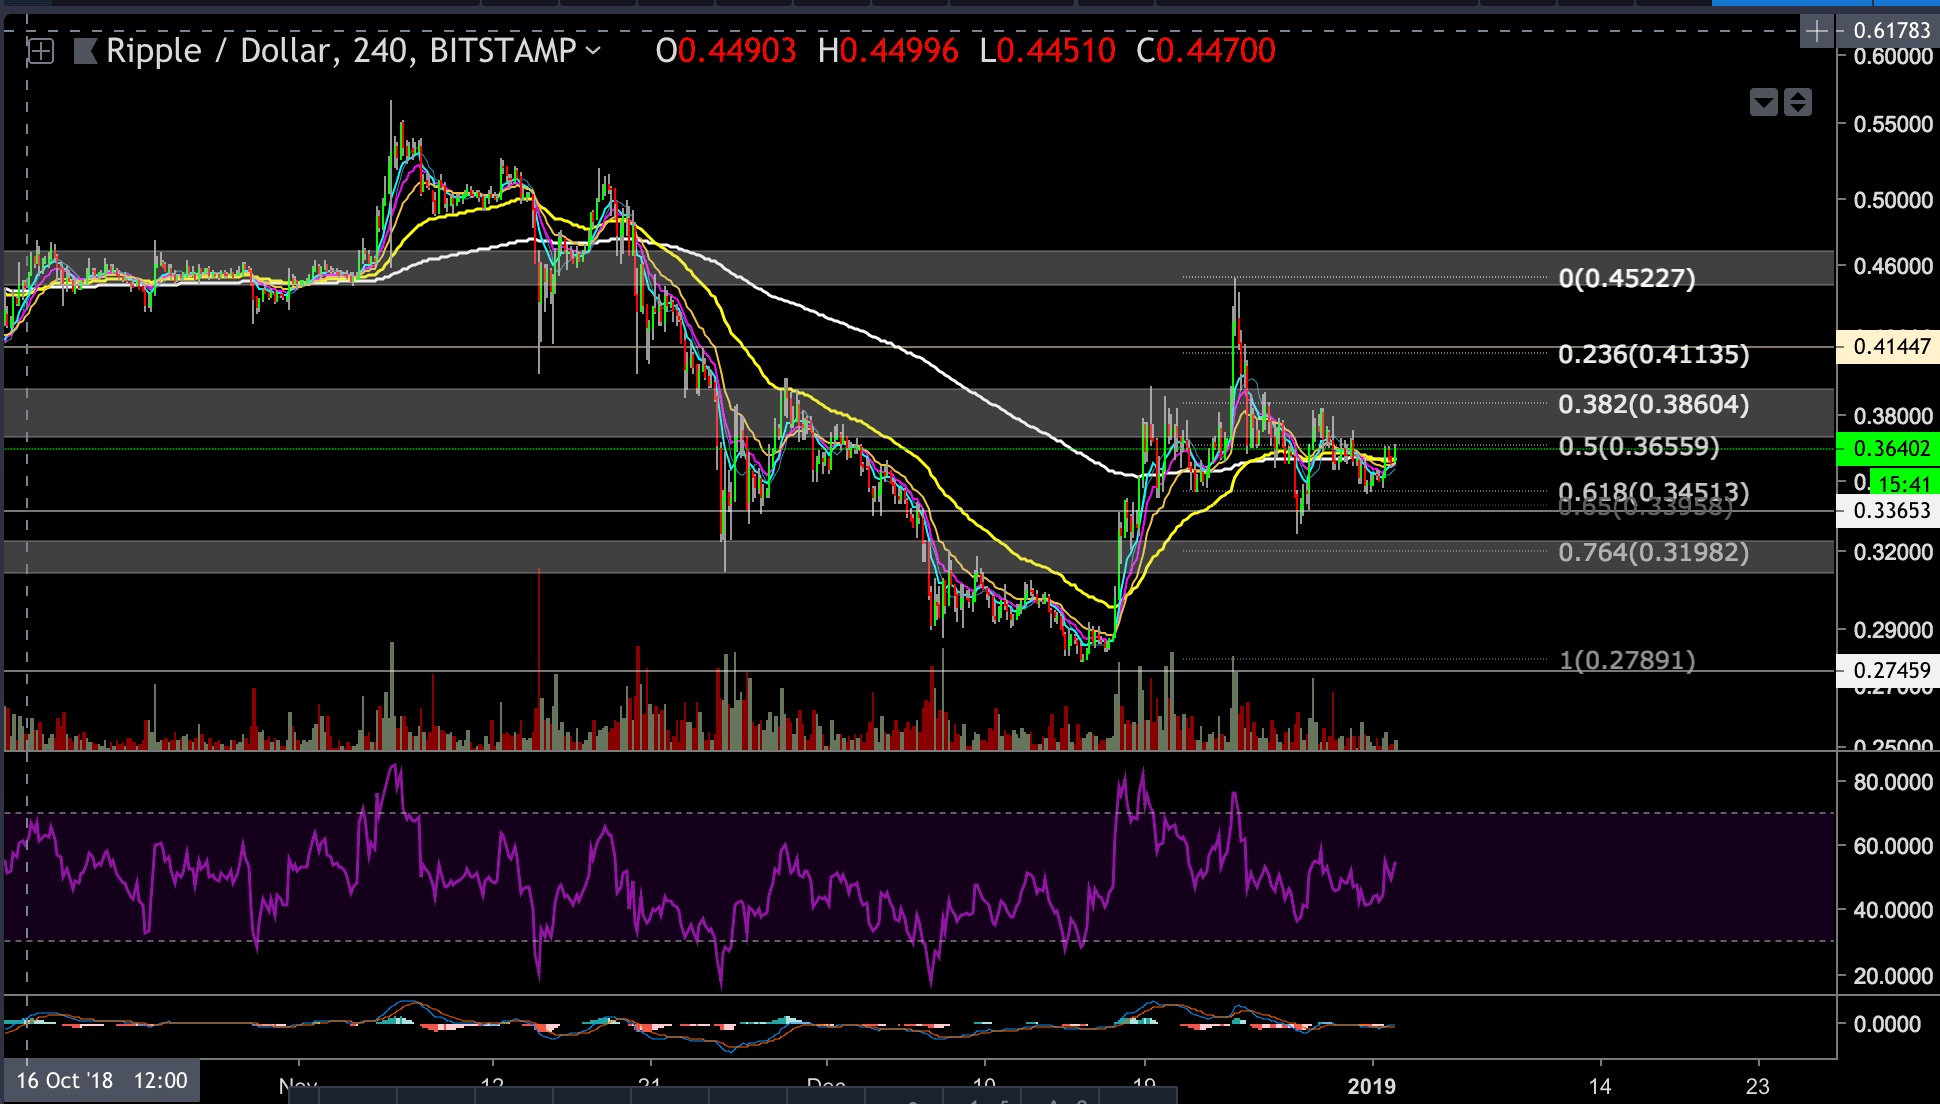
XRP is currently trading around the $0.36 price level, and we can notice that the 200 EMA (marked in a white line) and the 55 EMA (yellow line) are curling around each other, which is likely a sign that a sharp move is about to take place soon.
Looking at the 4-hour chart
BitStamp XRP/USD 4-Hour Chart
BitStamp XRP/USD 1-Day Chart
XRP-BTC Markets
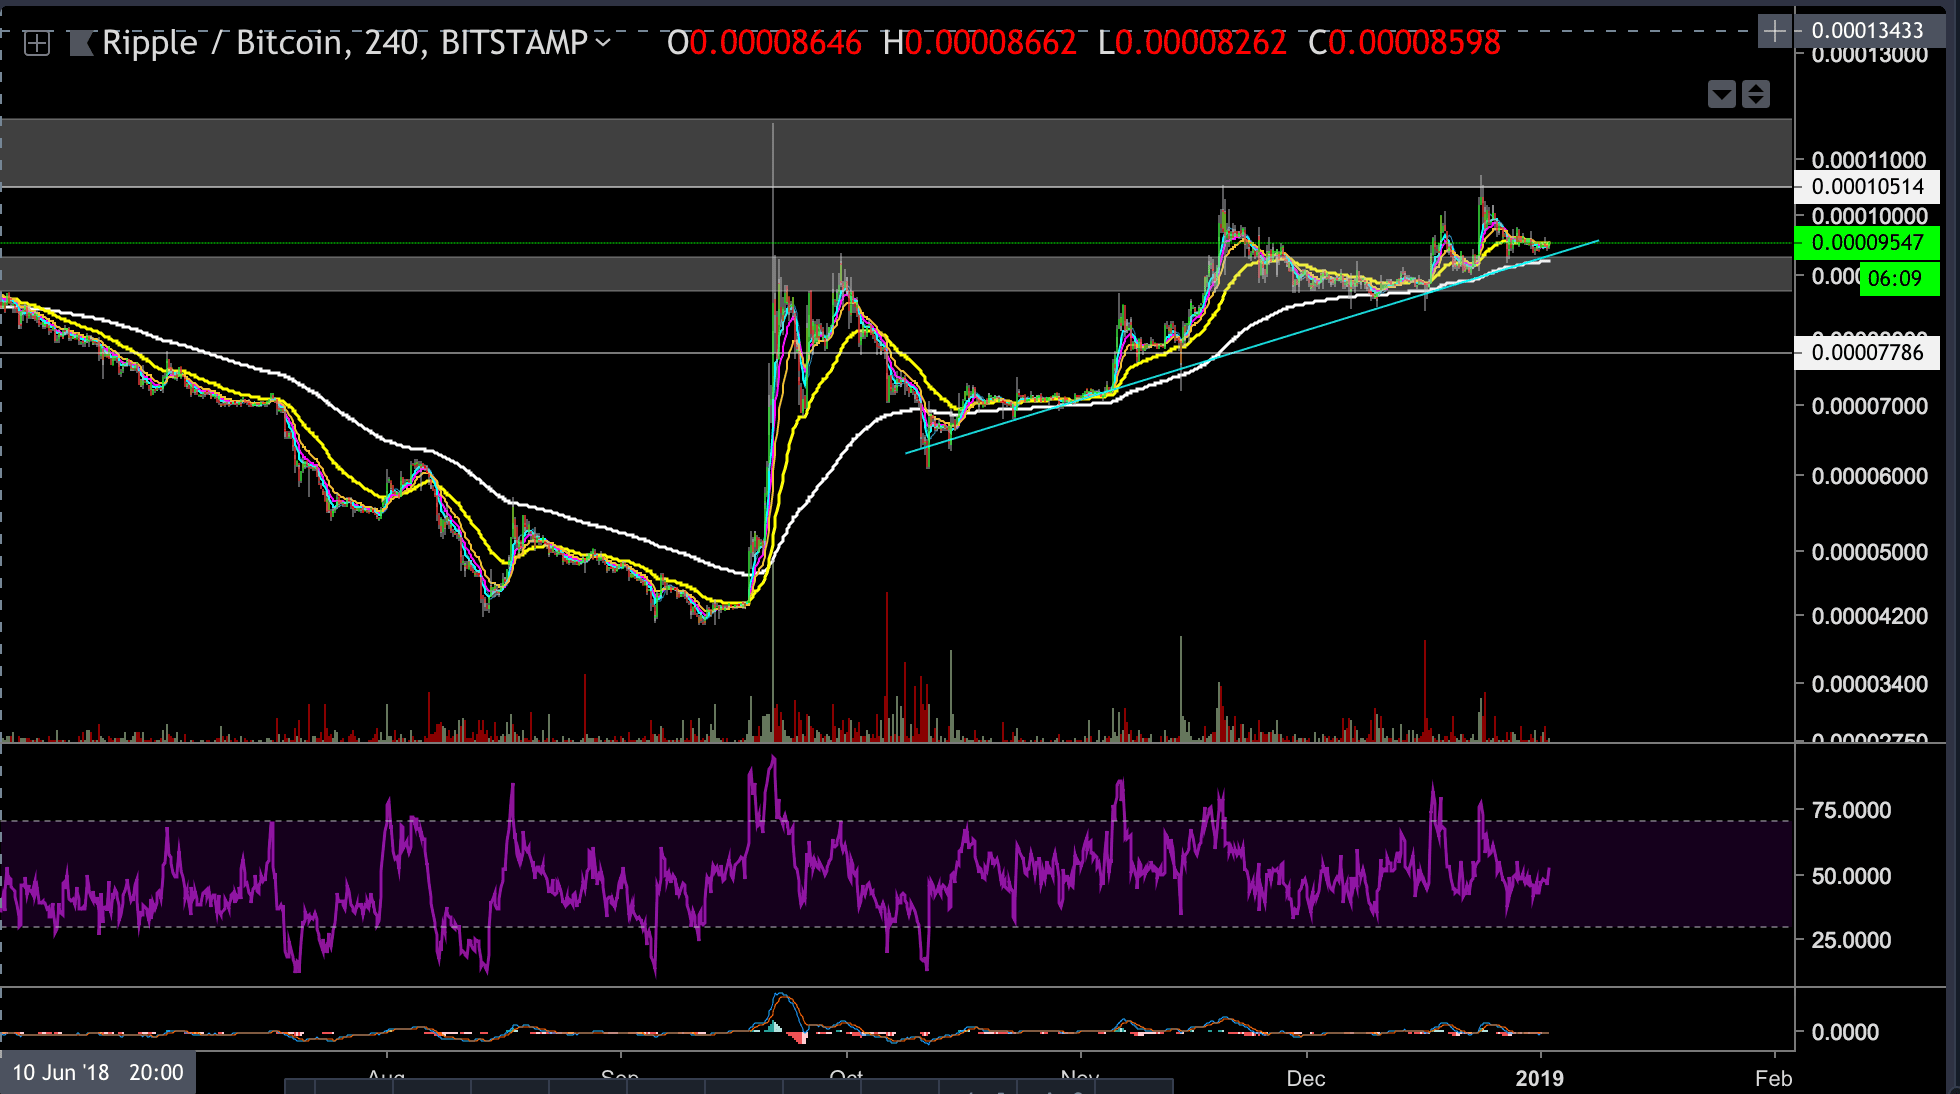
On the XRP-BTC 4 hours chart nothing much has changed, whereas XRP is trading above the 0.000093 BTC support level and the blue supporting trend-line (shown on the following chart).
The next bullish target could be found at the 0.000105 BTC – 0.000115 BTC resistance level, and on the other hand, if support level gets broken, then next bearish target could be found around 0.000084 BTC or lower at the 0.000078 (200 EMA).
BitStamp XRP/BTC 4-Hour Chart


Support this Site


Article comments