Ripple XRP Price Analysis Dec.24: Following 50% Weekly Increase, What’s Coming Up?

Before we dive into the current XRP status and analysis, let’s start with a wider time-frame review (looking at the following daily XRP-USD chart):
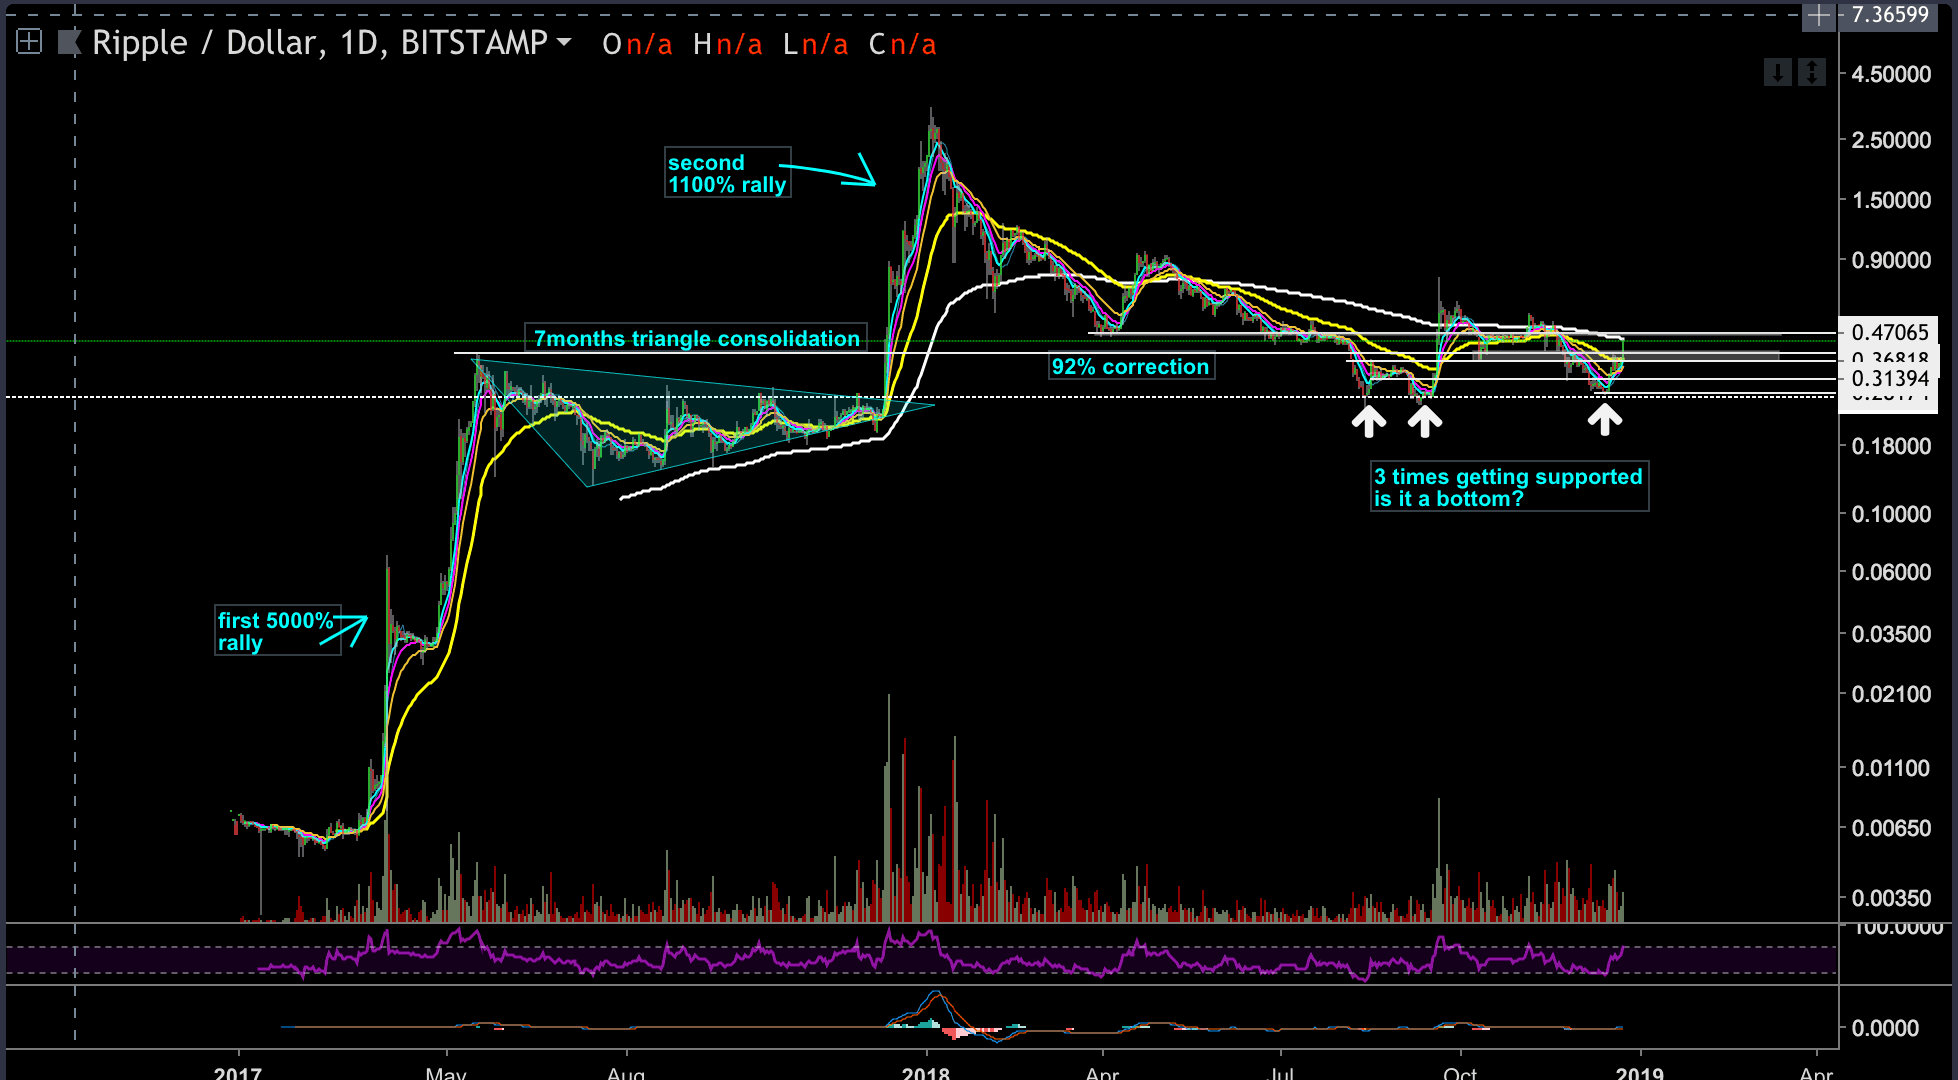
XRP had two significant rallies in its short history: The first XRP rally began in March 2017 and lasted for two months. That move had granted XRP’s investors more than 5000%, an unbelievable yield. Every $1000 that was invested would have turned into $50,000. XRP’s price went from $0.006 up to $0.37.
From that point until December 2017, XRP consolidated in what seems like a near perfectly triangle formation. It took around seven months for the triangle to develop: from the formation’s inception until the apex.
The breakout of the triangle had triggered the second XRP rally, from $0.27 to the all-time high at $3.3. 1100% yield.
Since the peak reached on January 2018, XRP lost 92% of its value in a five wave’s decline that took over 11 months.
What is interesting is the fact that XRP corrected precisely to the $0.27 price level, which was the trigger price of the last triangle formation that initiated XRP’s recent rally. Well, this is not a coincidence. Those are the technical rules of markets, or how “market makers” play the game.
XRP had touched the $0.27 price level three times since August 2018, in what seems to be a solid floor.
It is fascinating to notice that even after a 92% loss, XRP is still trading above the first rally’s price level and the 5000% move.
So what’s next for Ripple XRP?
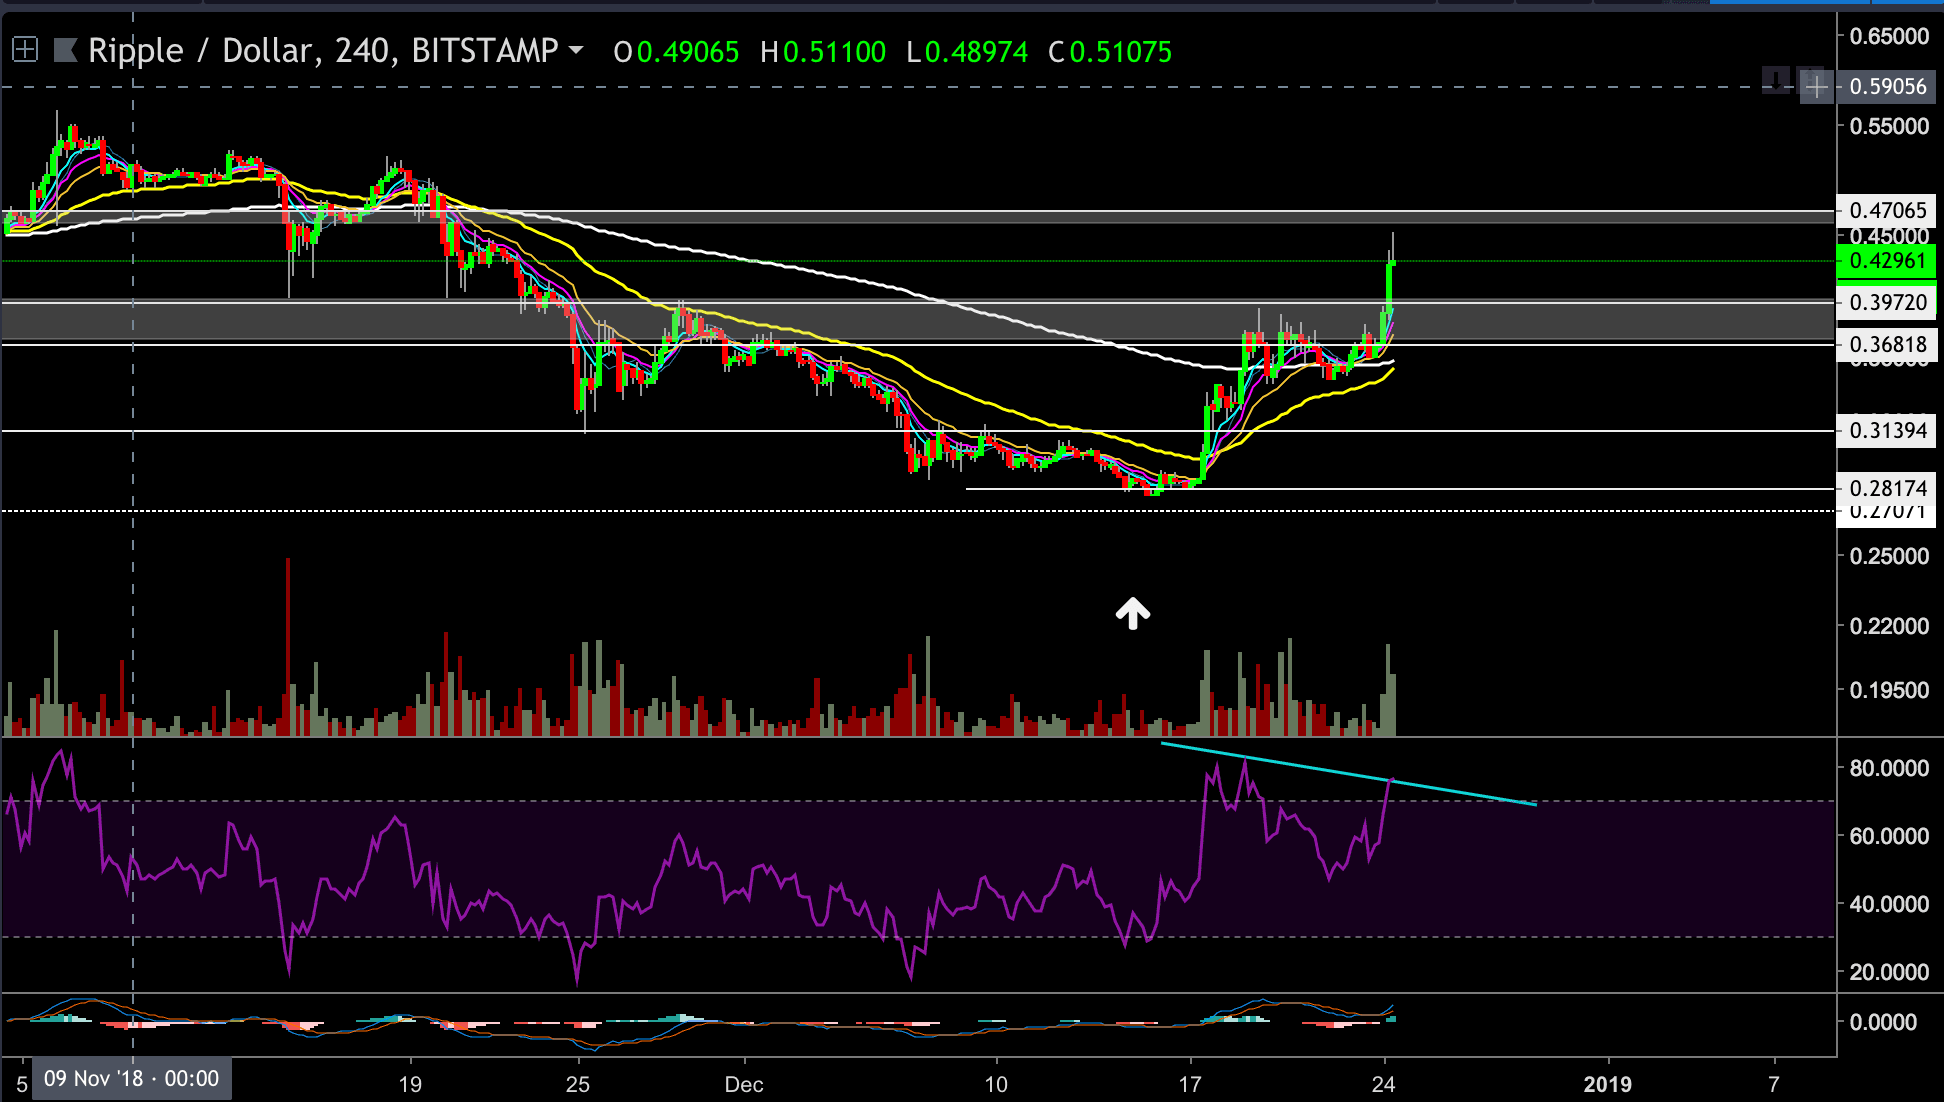
XRP/USD BitStamp 4-Hour chart
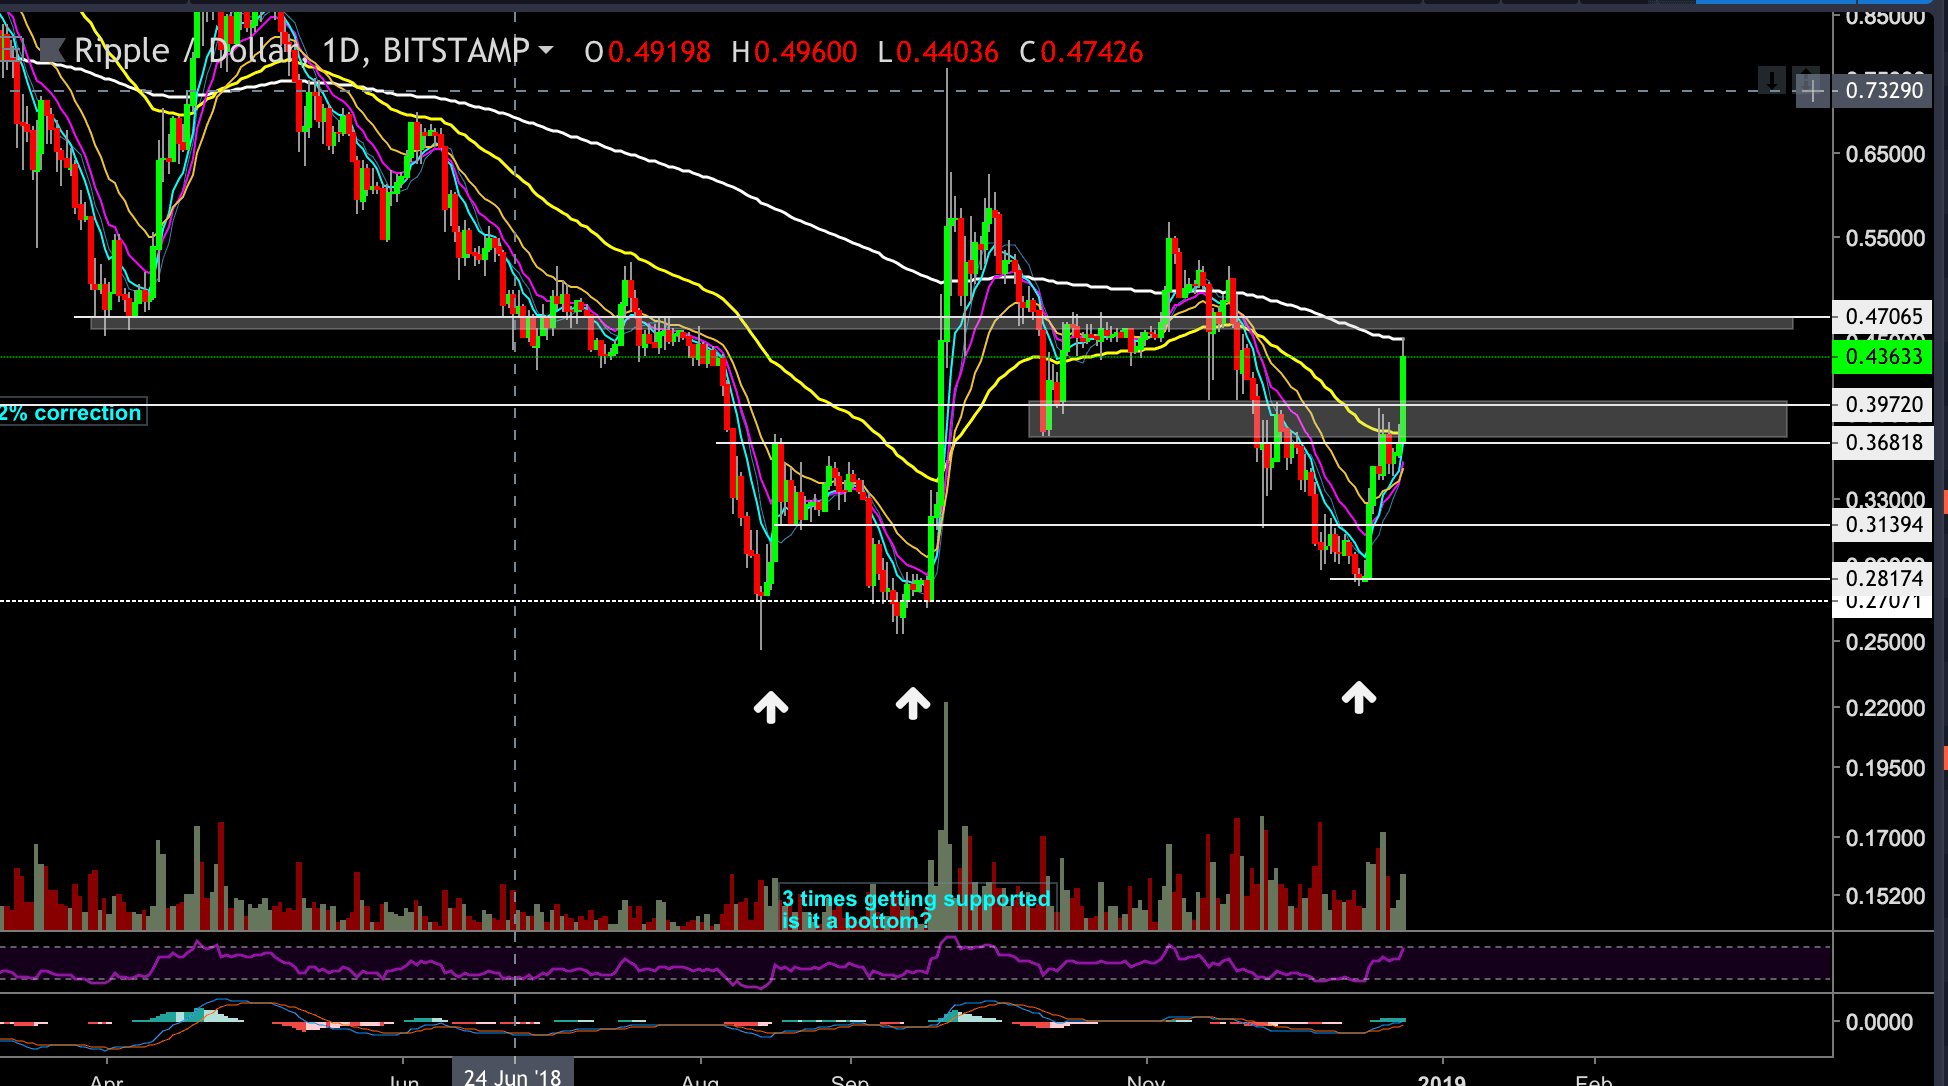
XRP/USD BitStamp 1-Day chart
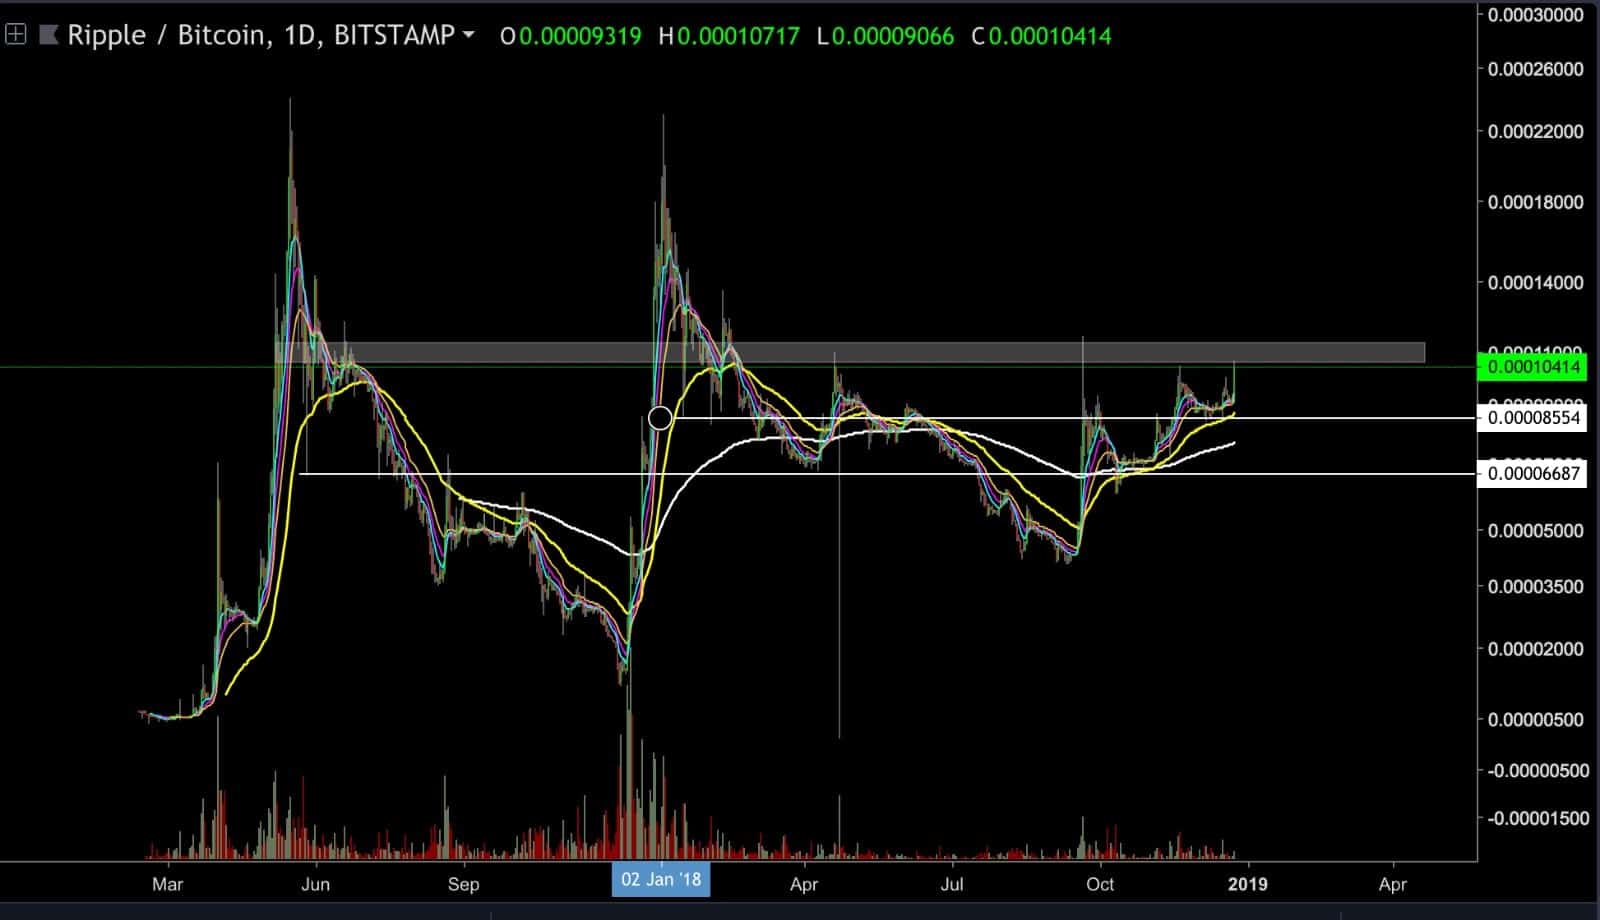
XRP/BTC BitStamp 1-Day chart
Looking at the 1-day XRP-BTC chart, we can see that XRP is approaching the 0.0001-0.000115 BTC resistance area for the fourth time. It recently spiked above this resistance level on the 19th of Sep.2018, and turn immediately back down. Since then, XRP tried a few more times to approach the significant resistance level, while creating higher lows in between. This is the most critical price level against Bitcoin at the moment while taking into consideration that from the bear side, the closest significant support level lies at the 0.0000855 BTC level, before the 0.000067 floor.


Article comments