Ethereum Price Analysis Oct.24: Still Sideways, with Bearish Signs
Not much have changed since our last Ethereum price analysis from Sunday; The Market is continuing the sideway move, and ETH follows it.
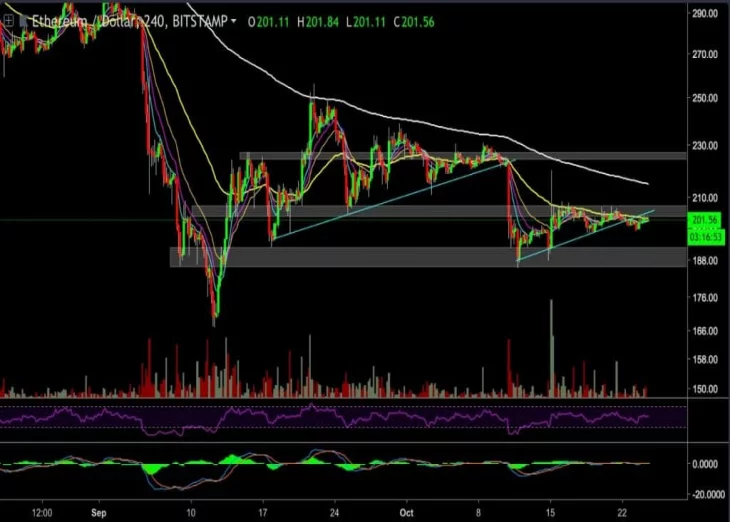
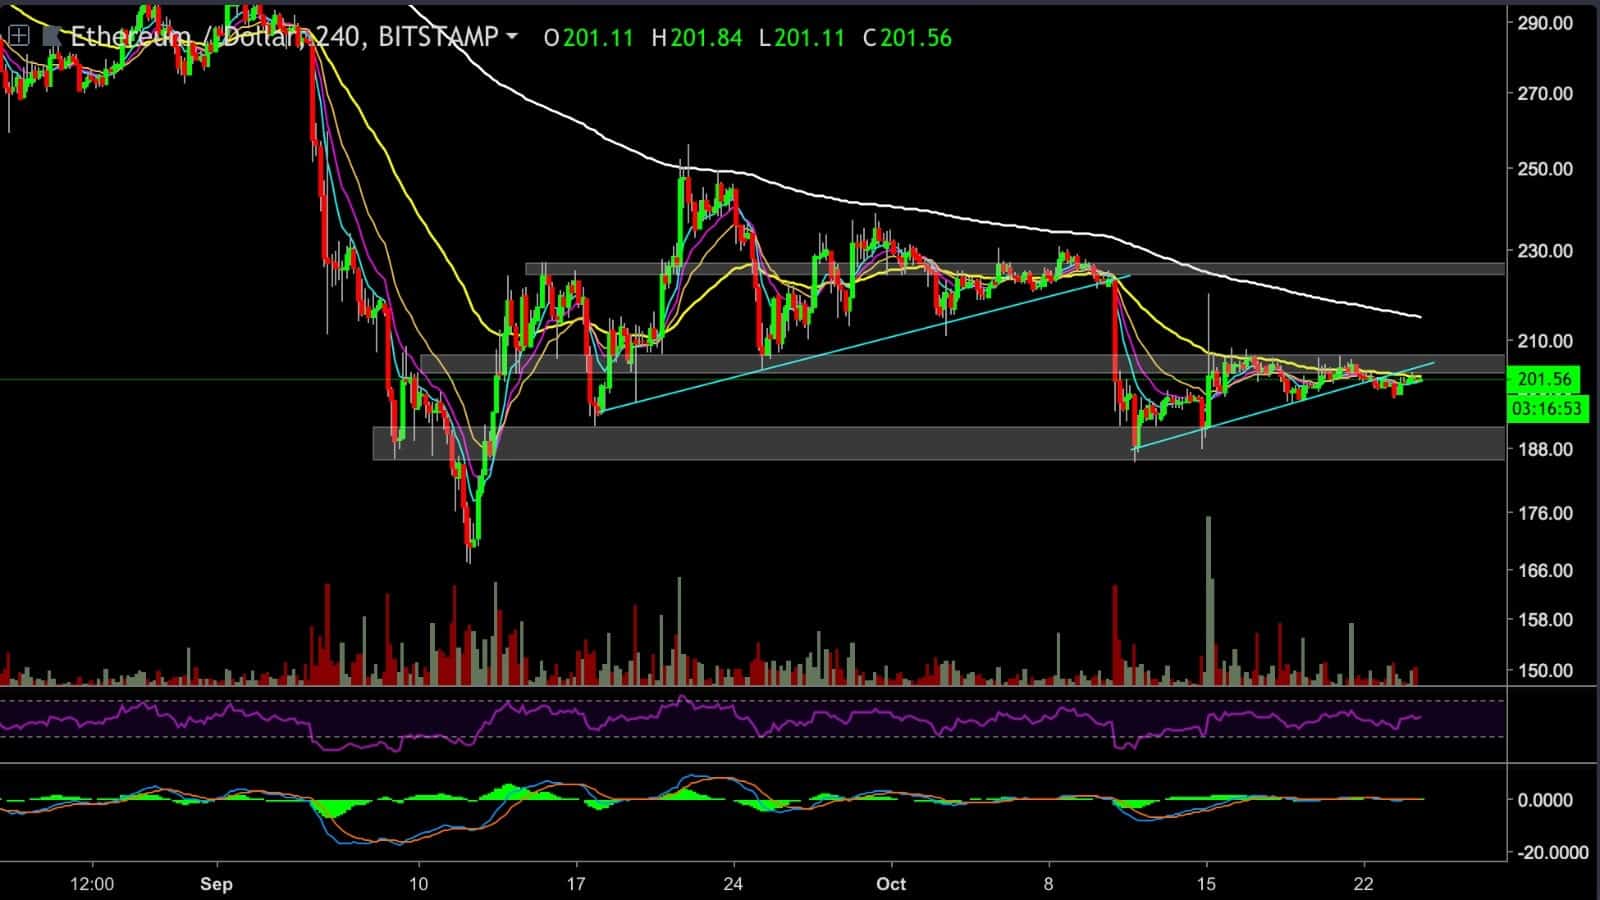
Looking at the 4 hours chart
– ETH was trying to break the resistance at the $205 price level for the second time, but buyers didn’t gain enough momentum to cross above the resistance level. ETH has been creating lower highs and higher lows during the continuous sideway move.
– With that said, after the second attempt to break the above resistance, ETH was pushed toward the blue minor trend support line and crossed below it; this acts as the first bearish signal for ETH.
– Second, on our previous analysis, ETH was trying to break above the 55 EMA (yellow line) but moved below it. At the moment, it acts as resistance as well.
– To sum up, ETH is still being locked inside the channel between $205 and $192. Because we notice more bearish signals then bullish ones, we should consider the possibility of another move down for ETH to the lower side of the channel before seeing any resolution.
– RSI and MACD are both neutral at the moment.
Trading tip of the day
Before entering any trade, always remember to find positive bullish signs to support the analysis along with a good risk/reward ratio. Otherwise, remember the first rule of trading – do not lose.
ETH/USD BitStamp 4 Hours chart
Cryptocurrency charts by TradingView. Technical analysis tools by Coinigy.


Article comments