Ethereum Price Analysis Oct.21 and Overview: A possible move to end the sideways?

As we can see at the moment the market is moving sideways inside a long descending triangle formation; a triangle has been developing for months now.
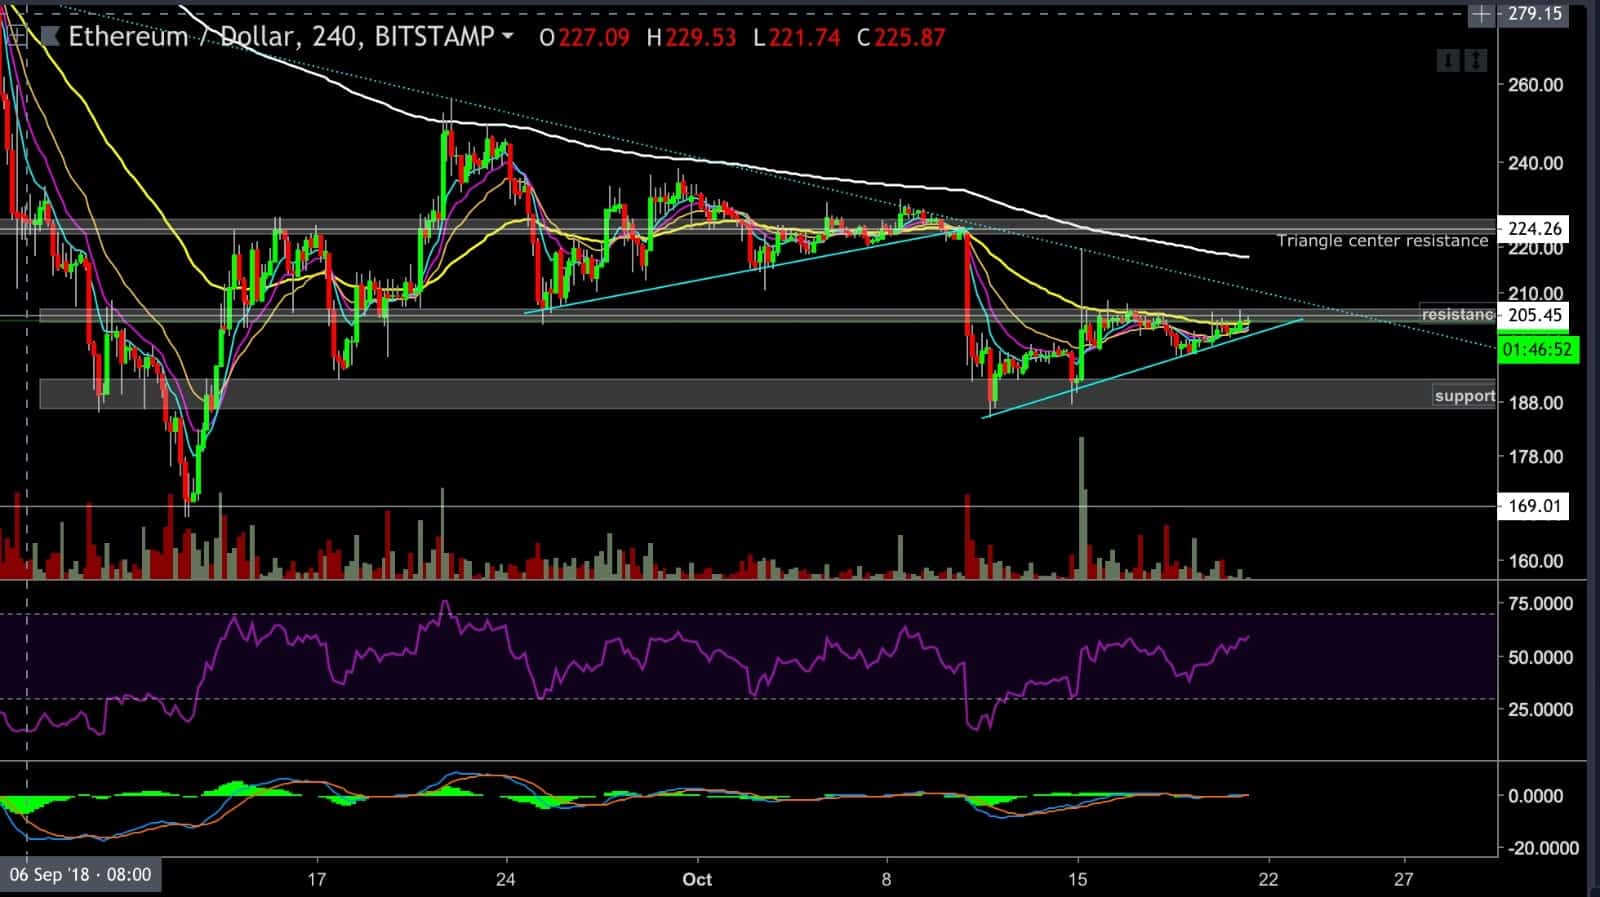
ETH is currently ‘locked’ inside a channel between the $205 resistance areas to the $192-$186 support level.
ETH 4 hours chart
– Since the last spike upwards, ETH has been attempting to break the resistance level of $205 (upper side of the channel) and had managed to slowly climb above the 55 EMA, which at the moment acts as a very close support level.
– If the bulls succeed in this mission and price will breach the $205 level, then the next resistance level will be the marked blue doted trend line – $210 ( this downtrend line haven’t been broken since mid-August).
– If the trend line is breached as well, then the next resistance level will be the $222-$226 price area which is the center of the previous triangle formation that had been broken to the downside, during last week.
– On the other hand, if the bears take the lead, they might try to pull ETH to the lower side of the channel at $192-186, and a break below those levels will open the door for a much more significant price drop with potential targets at the $170 price level.
– At the time of writing the RSI is above 50 creating higher lows and higher highs.
– The MACD histogram moved to the upper half of the 0 level which is a positive sign
We anticipate another attempt to break the resistance level in the next few hours, an attempt which will determine the next short to mid-term direction.
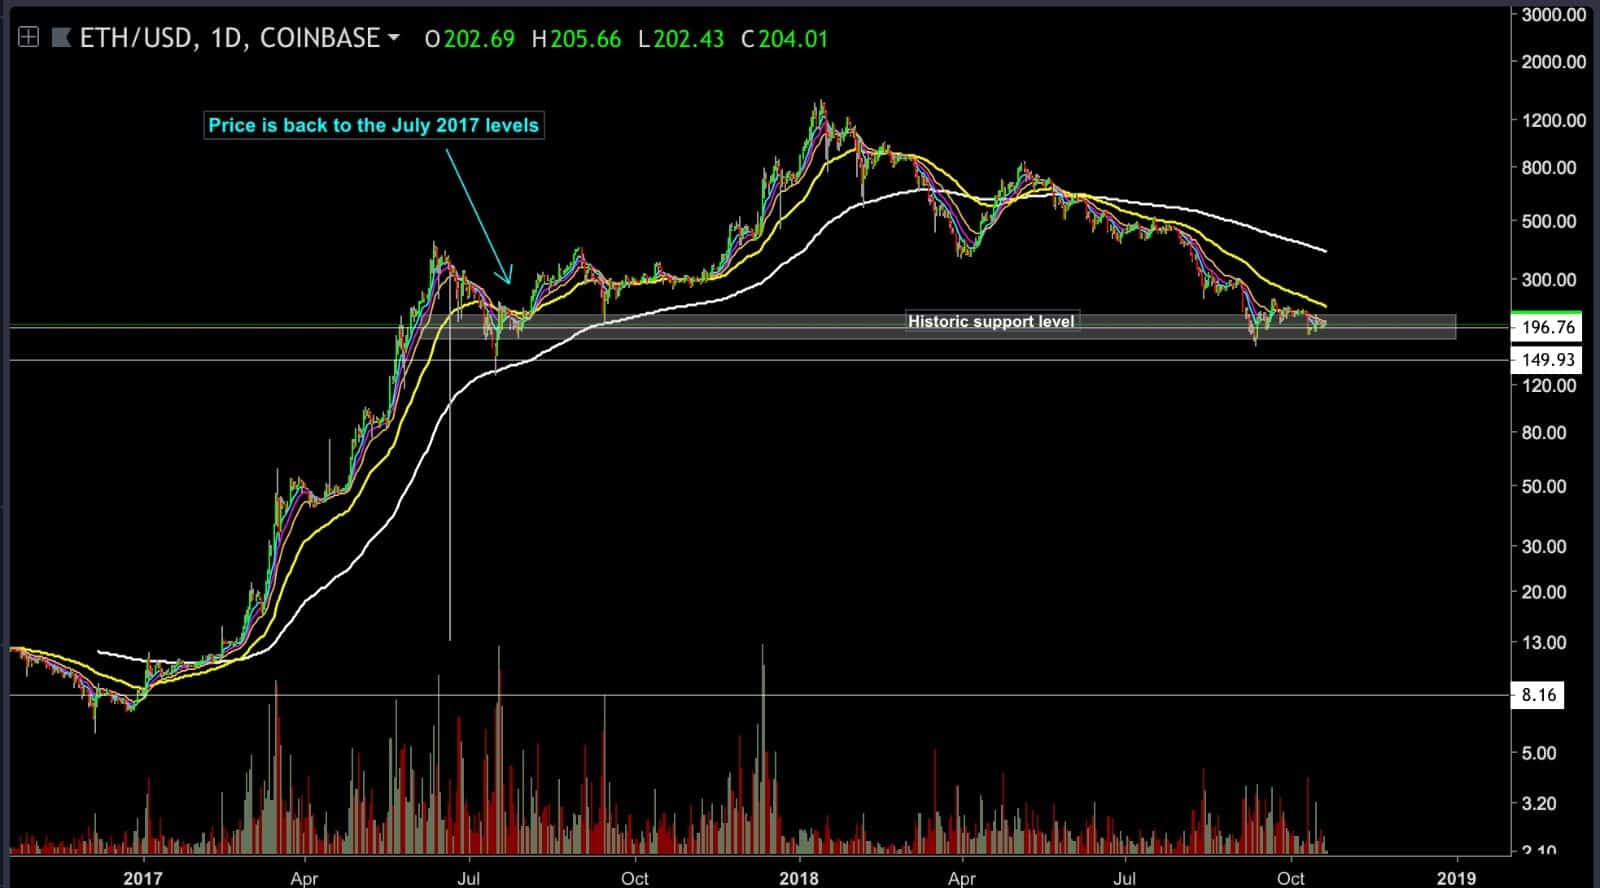
The ETH Logarithmic daily chart
The log chart is better suited for a longer time frame and the big picture.
A logarithmic scale chart refers to a type of chart that displays the distance between price movements along the y-axis in percentage terms as compared to a typical stock chart which uses an Arithmetic method.
As we can see in the following chart, ETH is back at the July 2017 price level which acts as a historical support level at the moment.
If those levels will get broken, it opens the door for a very bearish price scenario. But, at the same time, there could be a bear trap scenario: a fast and deep break and an immediate correction back up that will end up as a Hammer Candle with a long wick (bullish type of candle when appears at the end of a move down and even better on a strong support level).


Article comments