Ethereum Price Analysis Oct.17: Sideways action will have to break sooner or later
Since the colossal Tether related spike Ethereum (following Bitcoin) went through a few days ago, the market has been moving sideways.
ETH retraced nicely to the 0.618 FIB level (calculated from the peak of the big green candle to the bottom of $190) and since then, had consolidated below the trend line of the descending triangle that started in April this year (on the daily chart).
The bulls didn’t have enough momentum to keep the price above the trend line and, as we predicted. The huge candle was probably just another aggressive bull trap manipulation, curated by big whales trying to liquidate a short position.
ETH and the other major altcoins have been moving sideways as well, correlated to bitcoin.
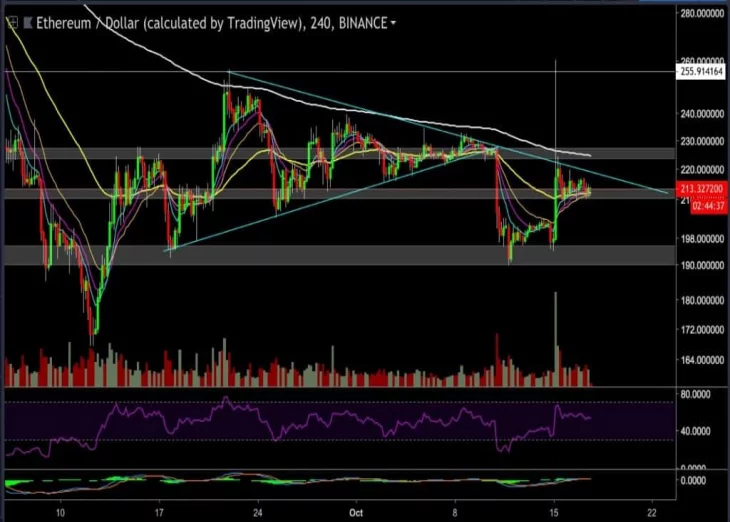
Looking at the ETH 4 hour chart
We can see how the current consolidation is encountering resistance from the downward trend line that has been developing for a very long time now (blue dotted line on the chart).
At the same time, ETH is getting support from the $214-$210 price level. However, this isn’t considered a significant support level area as we can notice how this support didn’t hold just a few days ago, during the radical rally upward and the rally downward as well.
The bottom line should be that the resistance level is stronger than the support level and we wouldn’t be surprised if ETH will soon visit the next support level at $195-$190 area.
With that said, If the bulls manage to move the ETH price above the blue trend line resistance level, then the next target should be around $228-$222, which is the center level of the last triangle and the current location of the 200 EMA.
RSI doesn’t give us any clues at the moment; it is very natural in the middle of the channel, around the 50 area.
Looking at the 30 minutes chart
We can see that ETH is currently being ‘locked’ between the 55 EMA, the 200 EMA, the 214$ support level and the smaller time-frame’s triangle formation trend lines. Trading Volume is very low.
This consolidation will have to break up sooner than later.
ETH/USD Binance 4 Hours chart
Cryptocurrency charts by TradingView. Technical analysis tools by Coinigy.
ETH/USD Binance 30 Mins chart
Cryptocurrency charts by TradingView. Technical analysis tools by Coinigy.


Article comments