Ethereum Price Analysis Dec.5: $85 is Closer Than Ever?
The Crypto market couldn’t find enough strength to go any higher.
At the moment of writing this post, the Bitcoin price is trading at the $3700 price level, below the symmetrical triangle formation boundaries (as we discussed in our last post) and is about to retest the previous lows for a possible continuation of the downward move.
If the bulls start setting buy orders at those levels, then the BTC chart has a chance to bounce upward from those support level, and fulfill the ABC correction analysis toward the $4200-$4600 targets.
But on the other hand, if the bears keep on pushing the price downward aggressively as they currently do, then we could witness a new yearly low with possible targets at the $3500- $3000 – $2500 price levels.
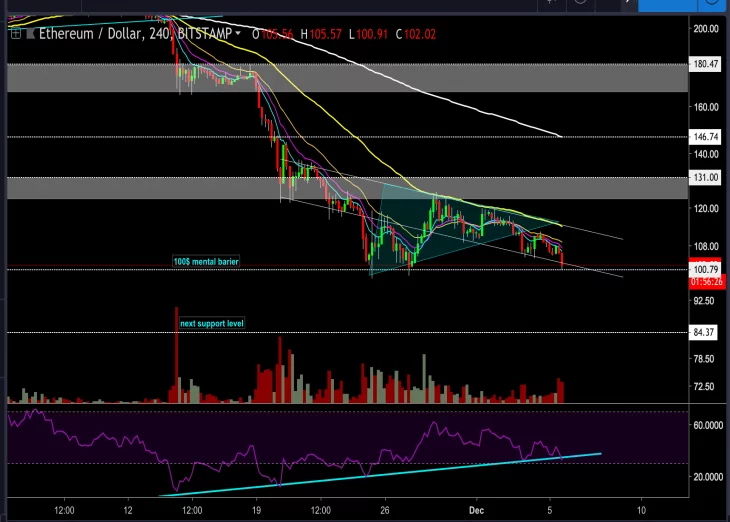
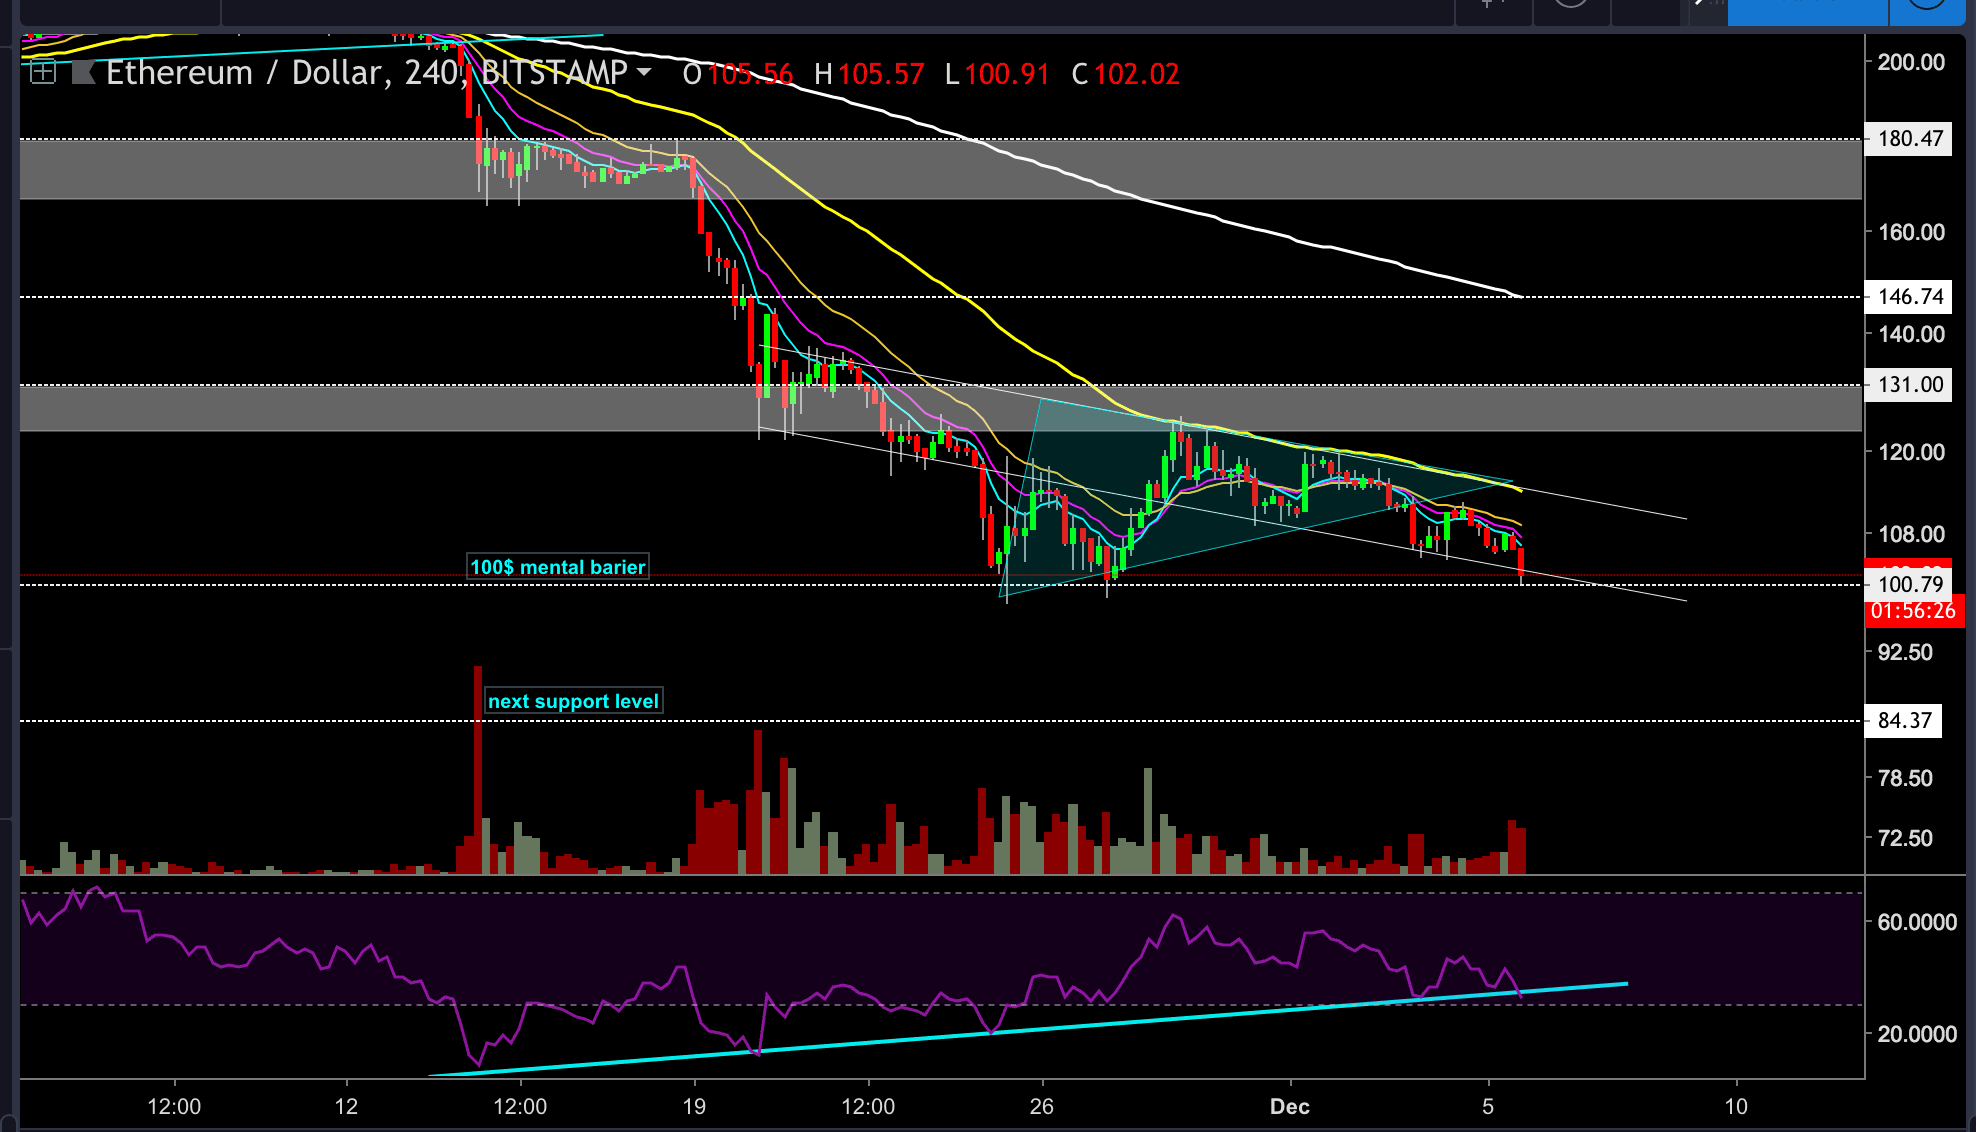
Ethereum chart, like all the other significant Altcoins, is moving with correlation to the BTC price, and as we explained in our last post, a failure to climb above the symmetrical triangle formation trend line will lead to a hard break downward and a retest of the $100 price level.
As for now, the ETH price is set at $103 and facing down.
ETH/USD BitStamp 4-Hour Chart
Cryptocurrency charts by TradingView. Technical analysis tools by Coinigy.


Article comments