Ethereum Price Analysis Dec.23: ETH Gains 30% In 2 Days. What’s Next?
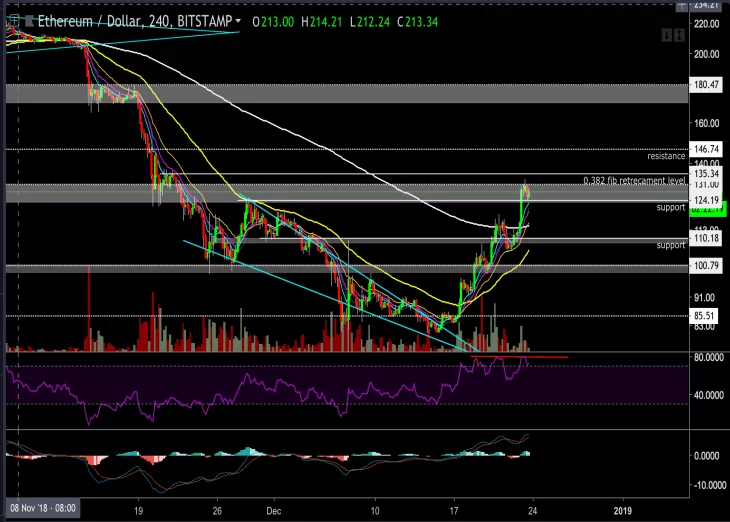
Since our last analysis, ETH price managed to climb above the 200-EMA (on the following 4-hour chart) and perfectly reached our target at the $124-$130 area. More than that, it almost reached the 0.382 Fib retracement level, which was our next target at $135.
During the last 24 hours, ETH was leading the crypto markets. The price had created a higher high, while Bitcoin’s chart couldn’t find the momentum needed for another higher leg.
At the moment of writing this post, BTC and ETH are moving sideways (1-hour chart) in what seems like a triangle consolidation pattern, or even more complex WXYXZ type of correction
(WXYXZ is a complicated Elliot Wave theory-based type of consolidation).
BTC is currently locked between the $3900 support level and the $4300 resistance level while ETH chart is fighting against the $130 resistance level.
We had a nice mini-rally during the past week, but this movement is slowly losing its momentum, and a correction down is maybe behind the corner.
Looking at the 4-hour ETH-USD chart
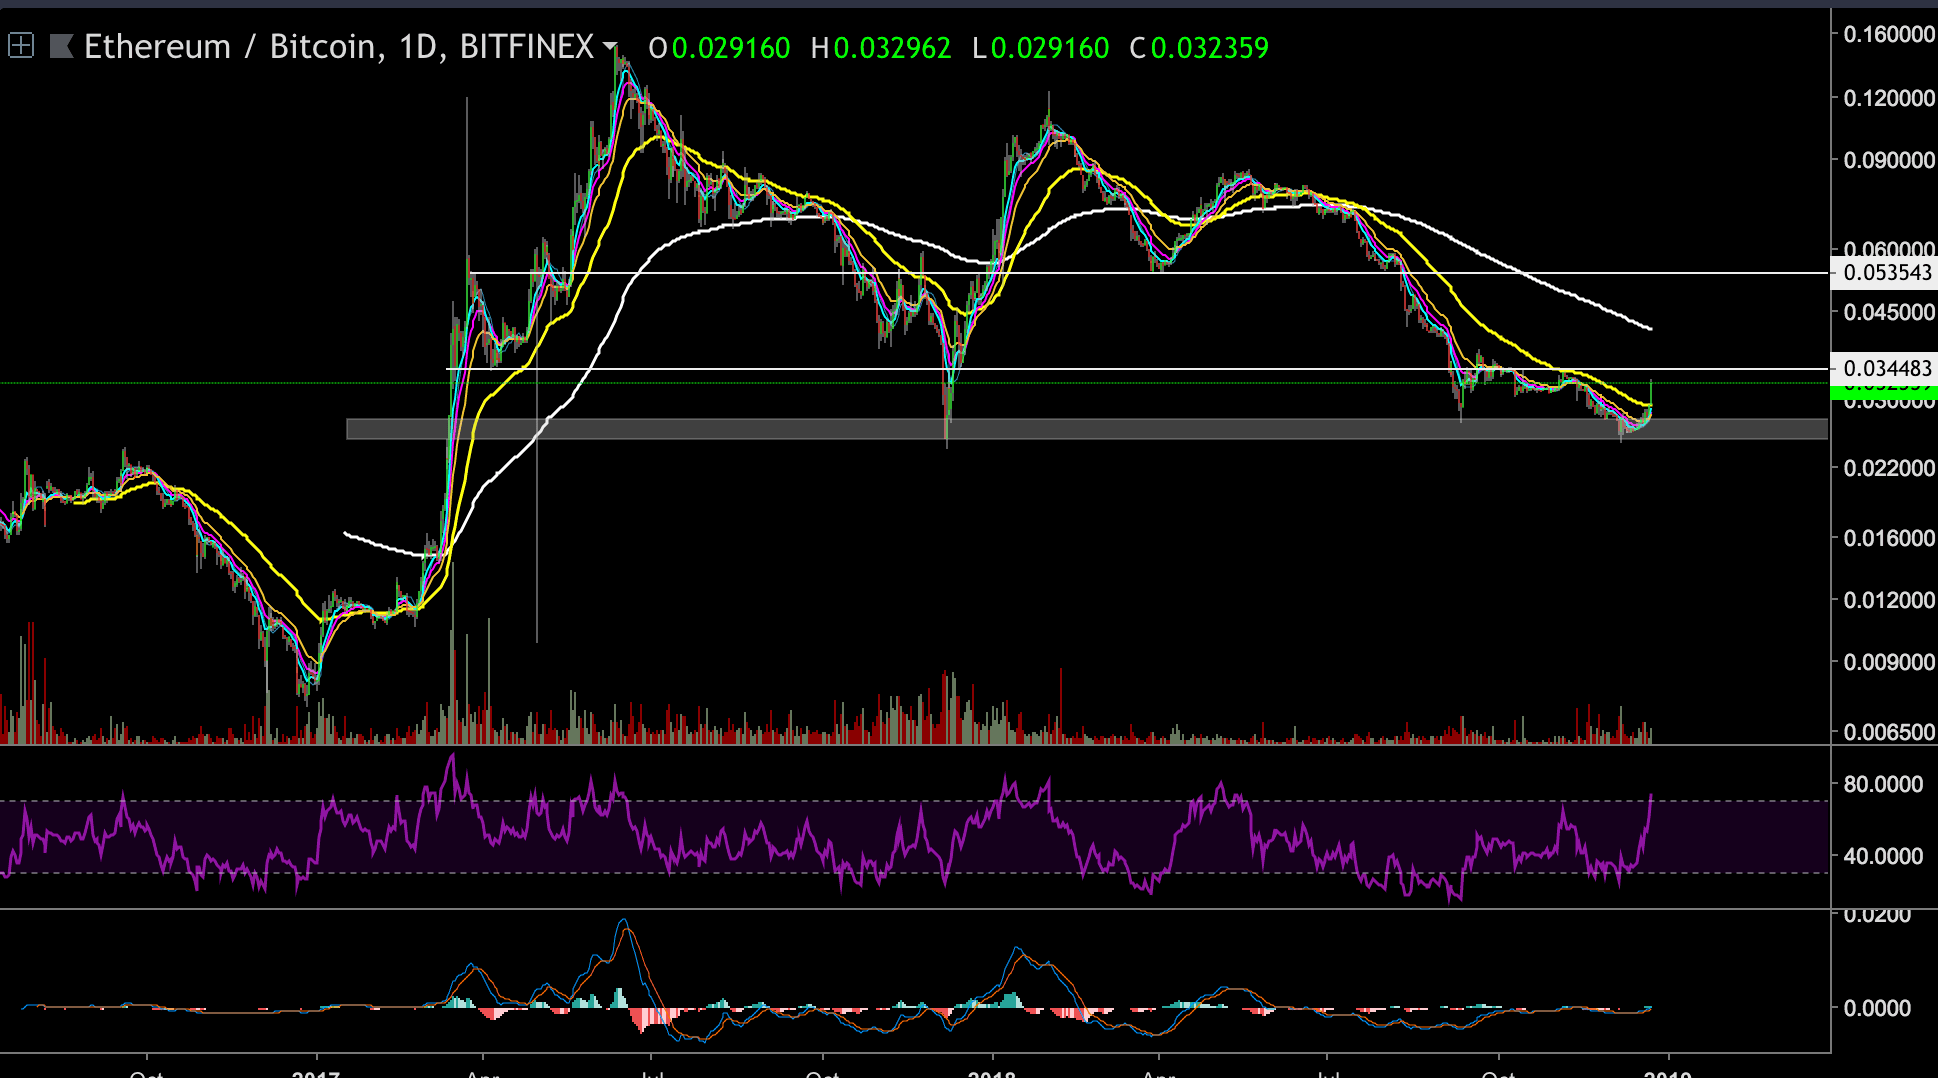
Looking at the 1-day ETH-BTC chart
We can notice that ETH found a temporary bottom floor at the 0.0247 BTC support level, and since then turned upwards very sharply.
The next resistance lies at the 0.0342BTC level. In case ETH reaches there, it won’t be easy to break up.
The RSI indicator is reaching the overbought regions.
ETH/USD BitStamp 4-Hour Chart
ETH/BTC BitStamp 1-Day Chart


Article comments