Ethereum Price Analysis Dec.12: Where Do You Go, Ether?
Since our previous analysis, the crypto market hasn’t done much and is still trading sideways. The Bitcoin chart is currently attempting to break above the descending trend-line resistance level that has been keeping the price below it for the past 14 days.
If BTC price breaks up the trend-line and the price holds above with an enormous amount of volume, it could be a positive sign for the bulls, at least for the short-term.
On the other hand, if BTC fails by the resistance level (looking for signs of shooting star candle or large red volume candle), it could be a sign that the bears are still in control and we could expect a continuation of the downward.
It is not clear at the moment where the market is heading to (in the short-term), and this attempt to break the resistance level will most likely point the next days’ direction.
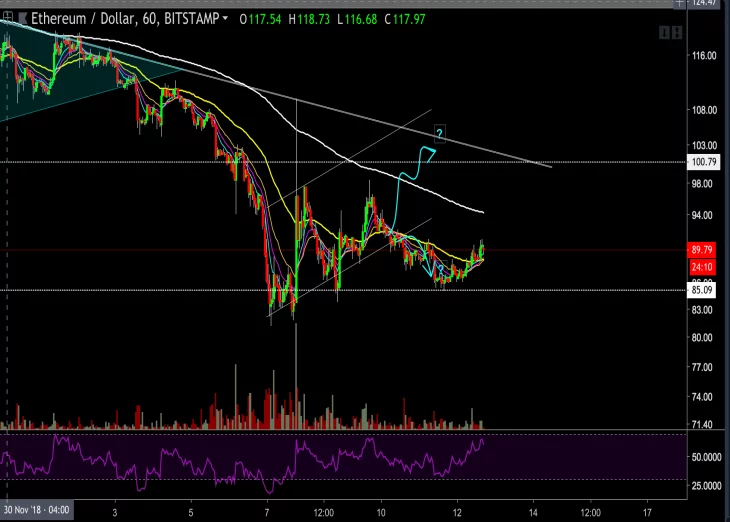
In our last analysis, we presented two continuation estimations on the ETH hourly chart. We can see that ETH chose the bear estimation, and broke below the trend-line support level. Since then ETH has been moving sideways.
Looking at the ETH chart
ETH/USD BitStamp 1-Hour Chart
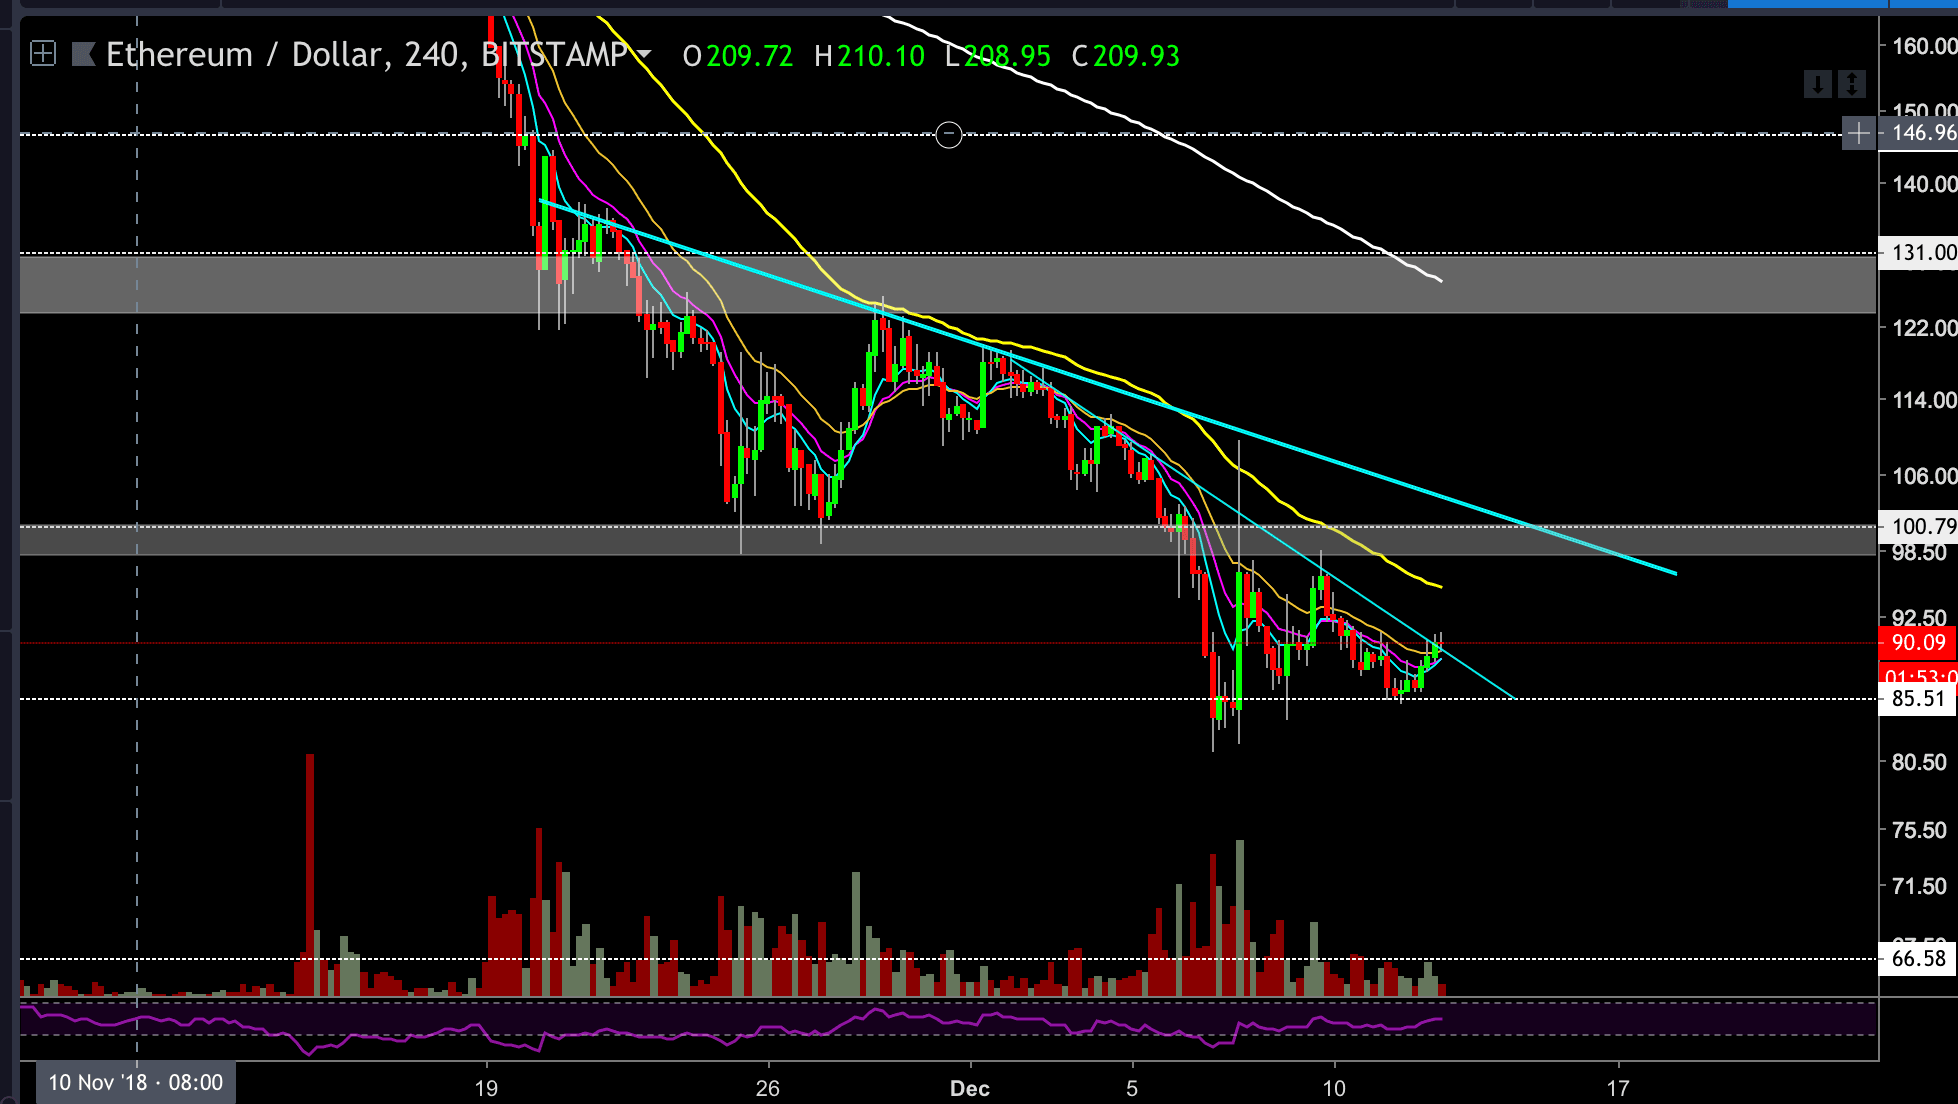
ETH/USD BitStamp 4-Hour Chart
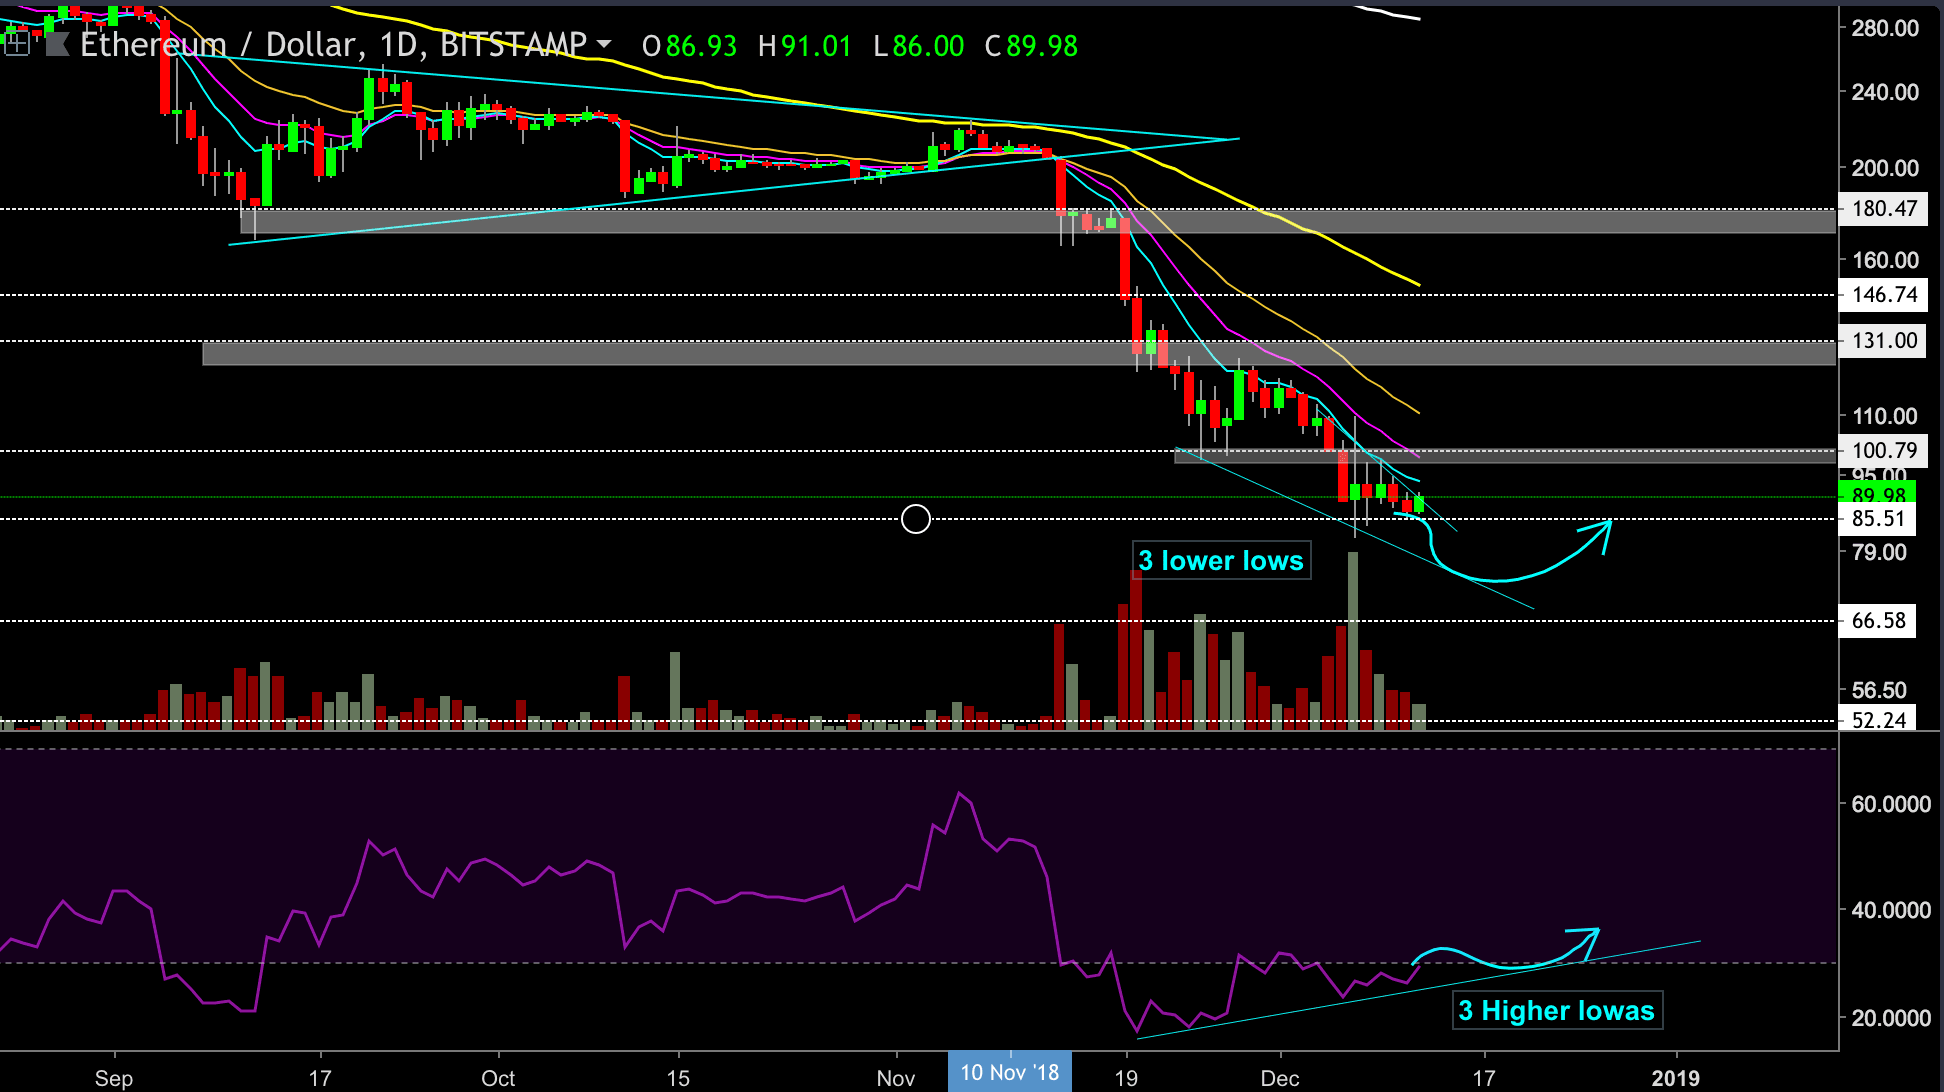
ETH/USD BitStamp 1-Day Chart
Cryptocurrency charts by TradingView. Technical analysis tools by Coinigy.


Article comments