Ethereum ETH Price Analysis Sep.20: Back to Stability?

Back in January (2018), with ETH prices nearing $1400, no one ever thought prices would return down to sub $200 levels. However, the current bear market that’s lasted most of 2018, has seen the entire altcoin market take a beating.
Many people are speculate that ICOs may be dumping the ETH they raised during the bull market, in order to stay in business during this bear market, which may have lasted longer than first expected. Others speculate that ETH may be dumping due to Bitmex introducing a new, highly liquid option to short ETH, along with their blog post about shorting ETH.
Seeing as how the entire crypto market currently reacts Bitcoin’s price action, it may be difficult to trade alts separately. However, here are some important current aspects for ETH, based on technical analysis.
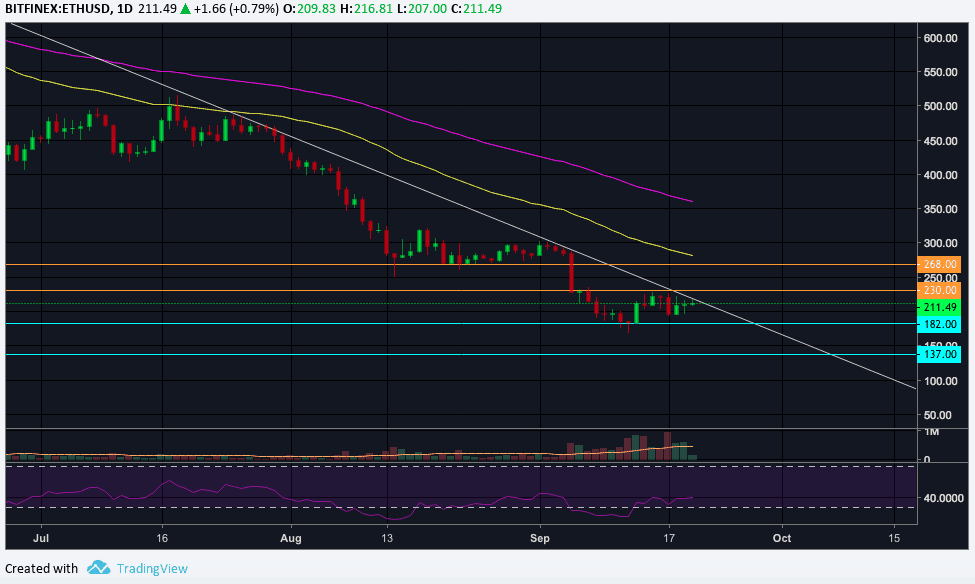
BTC/USD BitFinex 1 Day Chart
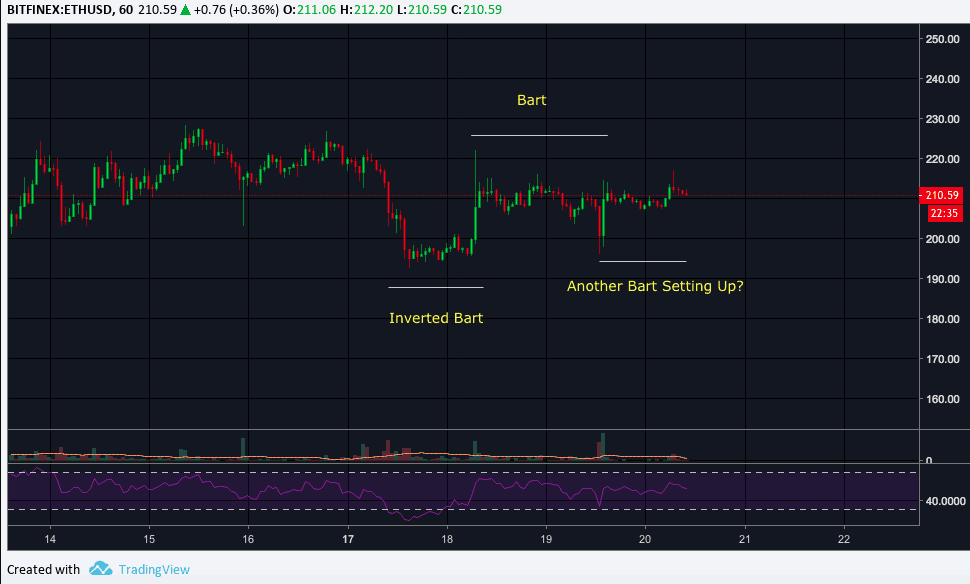
BTC/USD BitFinex 1 Hour Chart
On the 1 hour chart for ETH, we seem to be in “Bart Simpson” territory. Bart territory can often mean that there is not much true liquidity, with most trading being the result of bots, algorithms, and high leverage. Volume also correlates to the Bart patterns and another Bart might be setting up till decision, as seen below:
To Sum Up
The path of least resistance for ETH would be most likely bearish on the short-term, with only a few notable support zones left before a possible free fall capitulation potential to $100. One also must consider whether ICOs need more FIAT to keep their developments going on.
Cryptocurrency charts by TradingView. Technical analysis tools by Coinigy.


Article comments