Bitcoin Price Analysis Sep.9: Will the green spike hold?
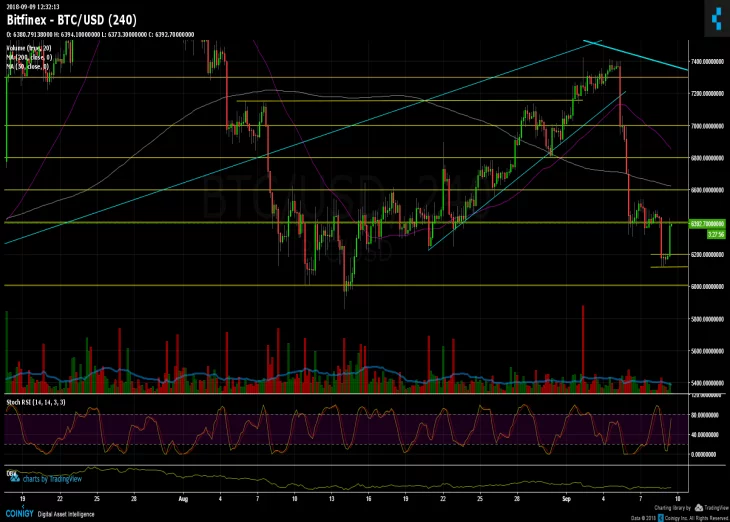
Following our Bitcoin price analysis from Friday: “Market seems to be weak. So weak hands can even lower the price more, to re-test strong support at $6000 and then to the yearly low at $5700 – $5800.”
The current low of this dump series stands (as of writing these words) around $6100. Despite the nice green candle Bitcoin had in the recent hours, market still seems very weak and can easily continue the drop to re-test $6000 and the 2018 yearly low at $5700.
The green candle is carrying a relatively low trading volume of buyers. Might be typical to weekends, but still not convincing at this moment.
Over the past three days, Bitcoin chart looks very unstable with huge candle of large market movement (mostly red negative candles), unlike the nice stable growth BTC had during the second half of August.
As of writing now, the nice candle has encountered the support-turned resistance at $6400 level. Breaking it up might send BTC to re-test $6600, where lies moving average 200 days (pink line in the chart) and $6800 (moving average 50 days).
From the bear side, which is most likely to see – support area at $6200, $6100, $6000 before the strong support (and last barrier) of the yearly low at $5700 – $5800.
Bitcoin Prices: BTC/USD BitFinex 4 Hours chart
Cryptocurrency charts by TradingView. Technical analysis tools by Coinigy.


Article comments