Bitcoin Price Analysis Sep.26: Correction or depression?
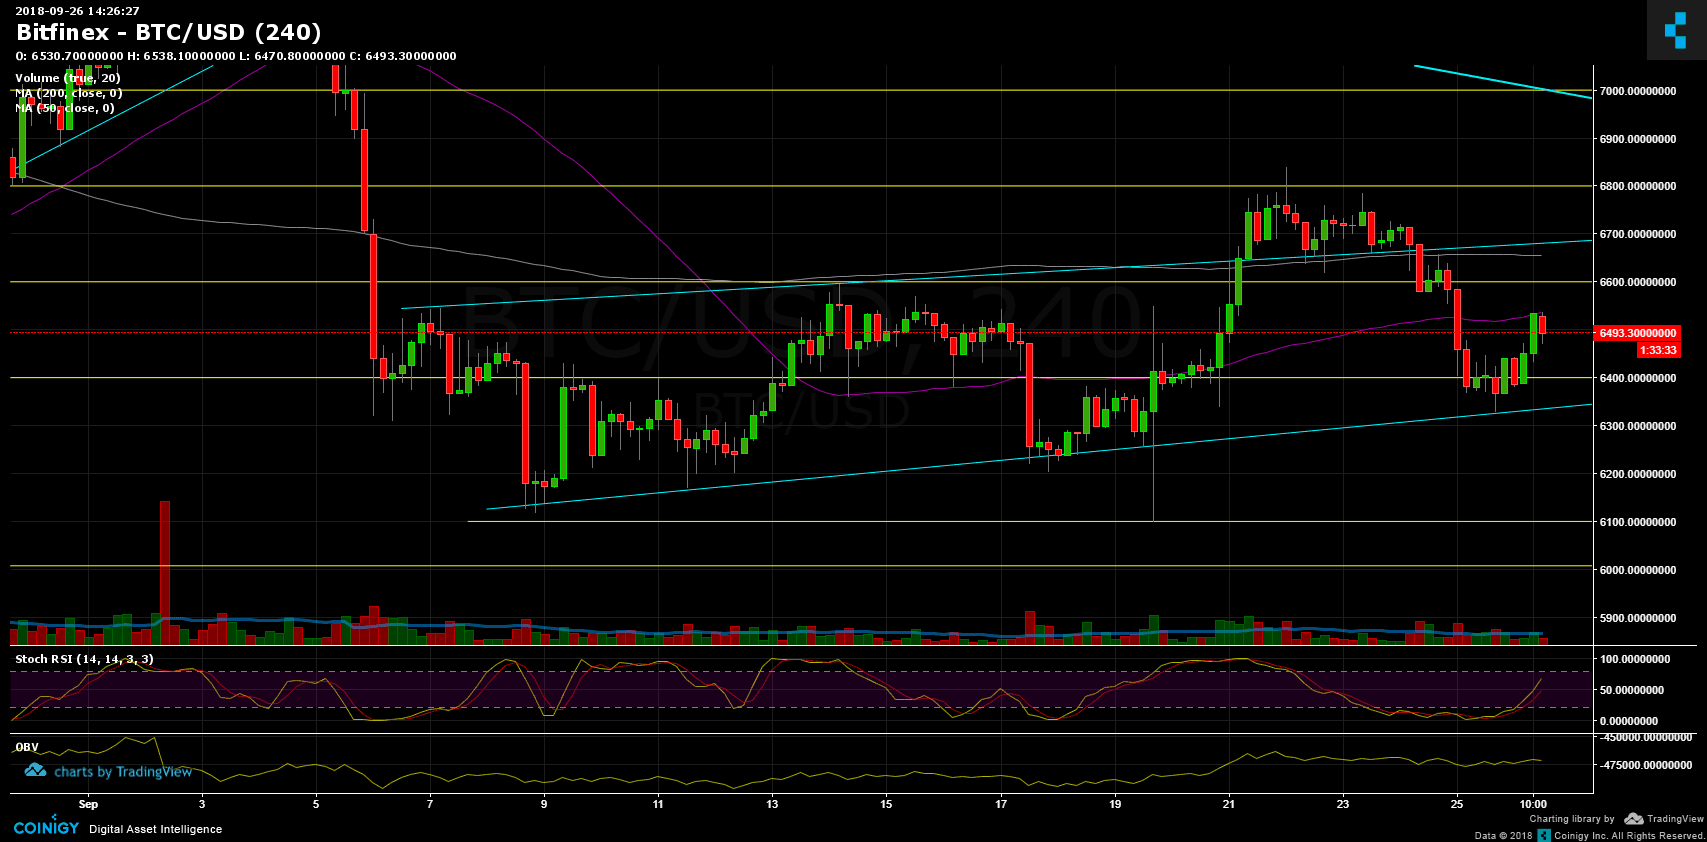
A quick update, following yesterday’s price analysis: “the $6400 range seems to be holding and we might see a little correction to re-test the 50 day moving average from below, this time as resistance. There also ($6400) lies the 38.2% Fibonacci retracement.”
The positive correction exactly encountered the 50 day moving average (the purple line) before turning down again.
Optimism isn’t back yet, unless the moving average is broken, which now lies around the $6530 price level, and then breaks the $6800 resistance level again.
As a reminder, the situation can change any minute regarding the SEC’s decision on the ETF.
Now what?
Bitcoin Prices: BTC/USD BitFinex 4 Hours chart
Cryptocurrency charts by TradingView. Technical analysis tools by Coinigy.


Support this Site


Article comments