Bitcoin Price Analysis Sep.20: A Very Weird BTC behavior
Heart attack! If you are new to crypto trading, then 12 hours ago you received a warm welcome. In less than 90 minutes Bitcoin went from $6330 to a low of $6100 (Bitfinex) and then climbed quickly to a high of $6550 before settling back in the good old range of $6300 – $6400.
What happened and what can be learned?
When looking for reasons, in my opinion it can be related to but not limited to one or more of the following:
And above all, the best explanation is that “this is crypto”. We’ve seen even more strange behavior over the past years of trading crypto. Let’s sum up and analyze the current chart:
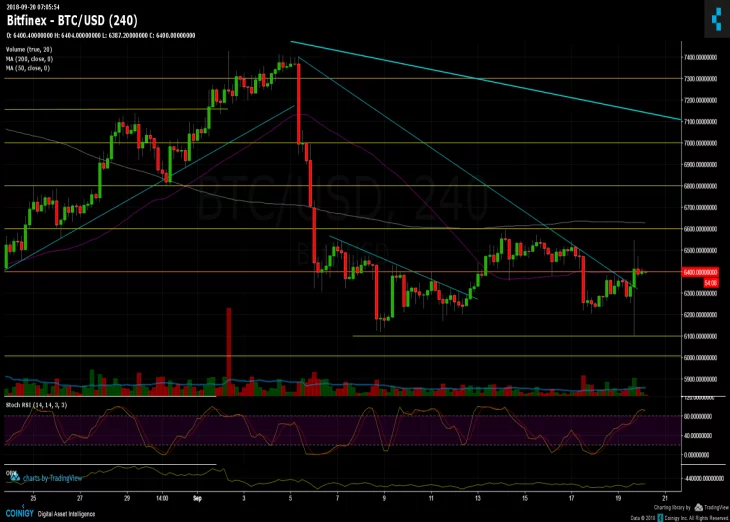
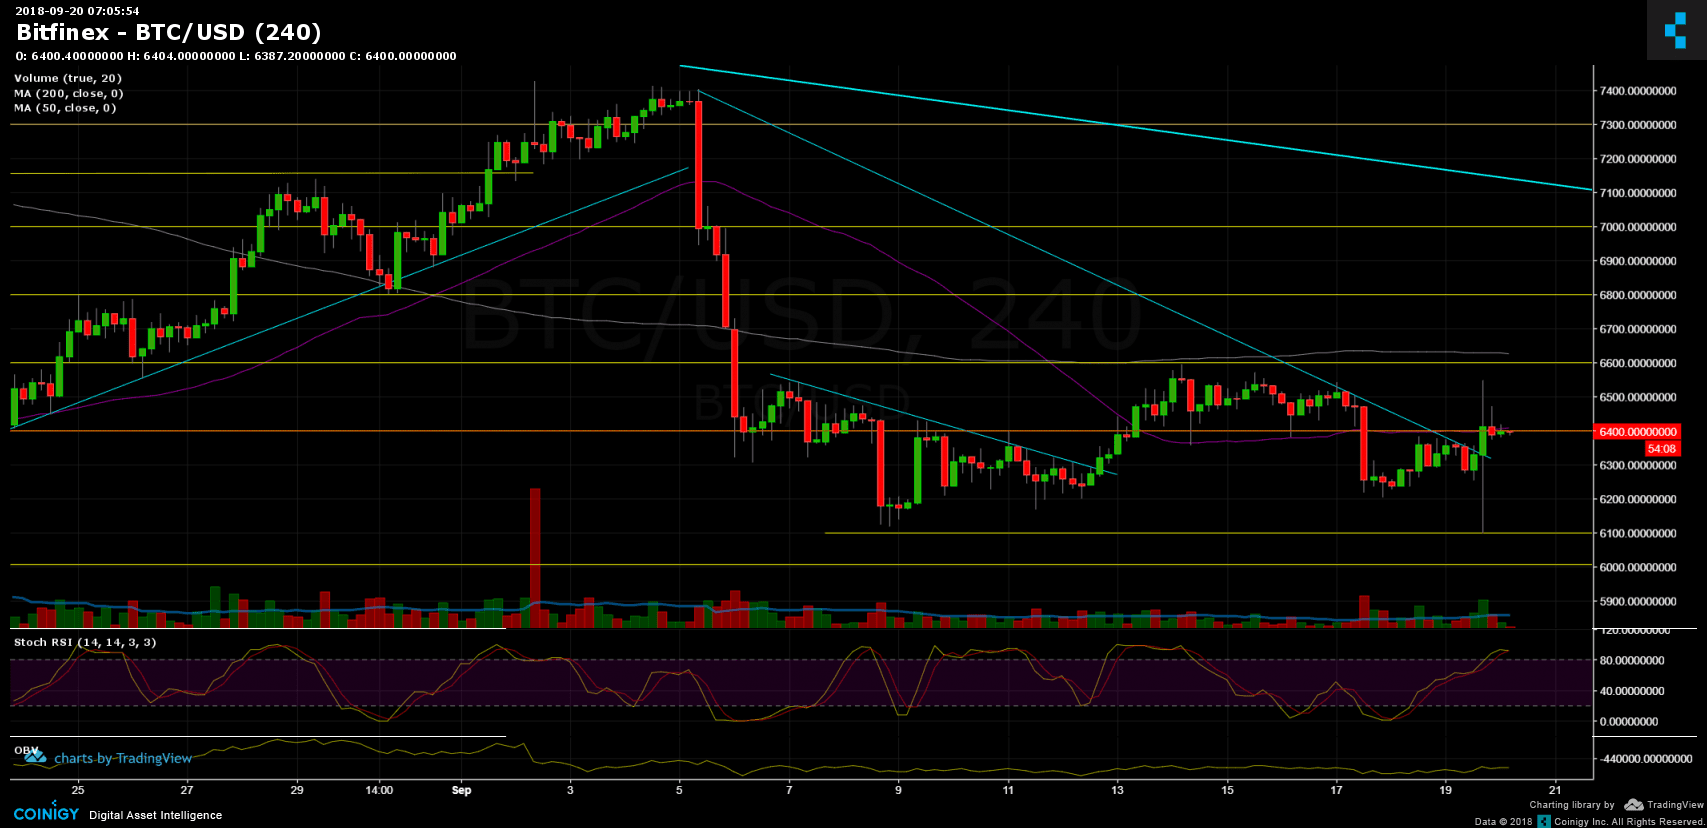
Bitcoin Prices: BTC/USD BitFinex 4 Hours chart
Cryptocurrency charts by TradingView. Technical analysis tools by Coinigy.


Support this Site


Article comments