Bitcoin Price Analysis Sep.2: Are the bulls back?
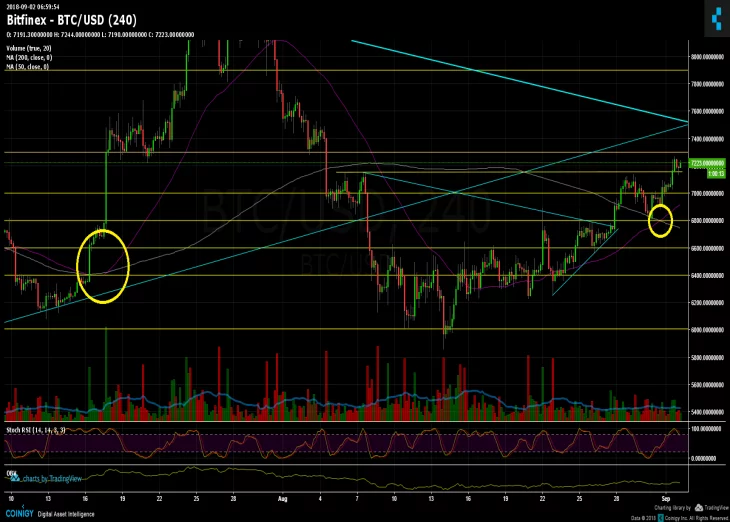
A new week is starting, following a bullish weekend. This is what we wrote on our previous price analysis: “The correction might stop in these areas (~$6800) where there is a resistance-turned support level along with Fibonacci retracement %38.2 level.” As of now, Bitcoin seems very healthy going towards the $7500 – $7600 resistance area.
What is more interesting, is that the moving average 50 days (purple line) had crossed over the moving average 200 days (pink line). The last time it happened was on July 17, when Bitcoin was $6400. This triggered a bullish run to $8500 (on July 24, just a week afterwards). The two crossing events are marked in yellow circles.
The trading volume is still pretty low, typically to weekends. In order for a bullish market, more money and more buyers need to step inside.
Also, right by the time of the expiration of the CME futures (last Friday at 15:00 UTC), there indeed was a strongn move, but to the positive side: the green candle from $6800 to $7013 (on BitFinex exchange).
To sum up
Support levels lie at $7000 (MA-50 – purple line in the chart), $6800, $6600.
Resistance levels lie at $7250 – $7300, $7500 – $7600 (the long-term descending line), $7900.
Bitcoin Prices: BTC/USD BitFinex 4 Hours chart
Cryptocurrency charts by TradingView.


Article comments