Bitcoin Price Analysis Sep.13: A short bear’s recess?
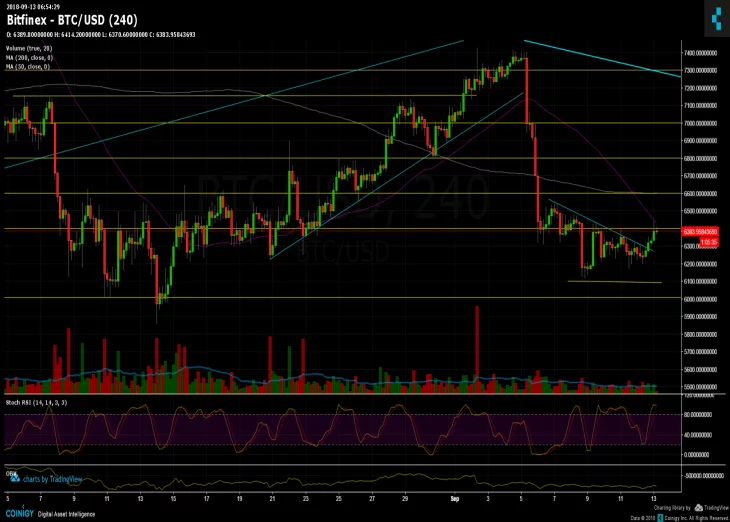
Following our previous price analysis, Bitcoin had breached out the descending trend line at $6270 for a nice green 4 hour candle up to re-test $6400 resistance level and moving average 50 days (purple line on the chart) at $6443 (BitFinex).
As of the recent hours, the current resistance level seems to halt BTC from continuing up to re-test the major $6600 level, where lies the important moving average 200 days (pink line).
The way up hasn’t been followed by decent amount of trading volume, what supports the option of a correction before re-testing $6000 zone. Also, RSI is at it’s high levels, though the market is overbought and might need a correction down in order to continue.
As mentioned before – cautious is needed! This kind of market is hard to trade with no real direction.
To Sum up
Resistance area at $6400 (moving average 50 days), and as mentioned $6600 strong resistance (moving average 200 days).
Support areas: $6300, $6100, $6000, $5700 – $5800 (yearly low – major support).
Bitcoin Prices: BTC/USD BitFinex 4 Hours chart
Cryptocurrency charts by TradingView. Technical analysis tools by Coinigy.
(function(d,s,id){var js,fjs=d.getElementsByTagName(s)[0];if(d.getElementById(id))return;js=d.createElement(s);js.id=id;js.src='https://embed.playbuzz.com/sdk.js';fjs.parentNode.insertBefore(js,fjs);}(document,'script','playbuzz-sdk'));


Article comments