Bitcoin Price Analysis Sep.11: Facing the 2018 yearly low
As the symbolic September 11 date is reaching the US, let’s hope for a different fate for Bitcoin – not to collapse.
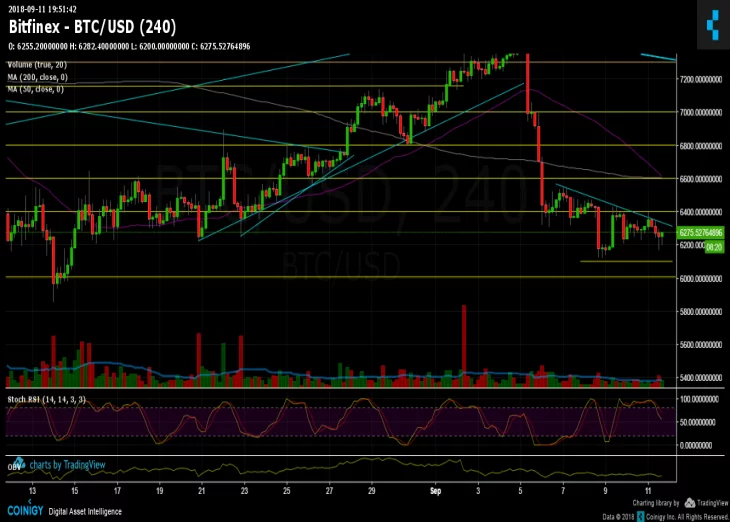
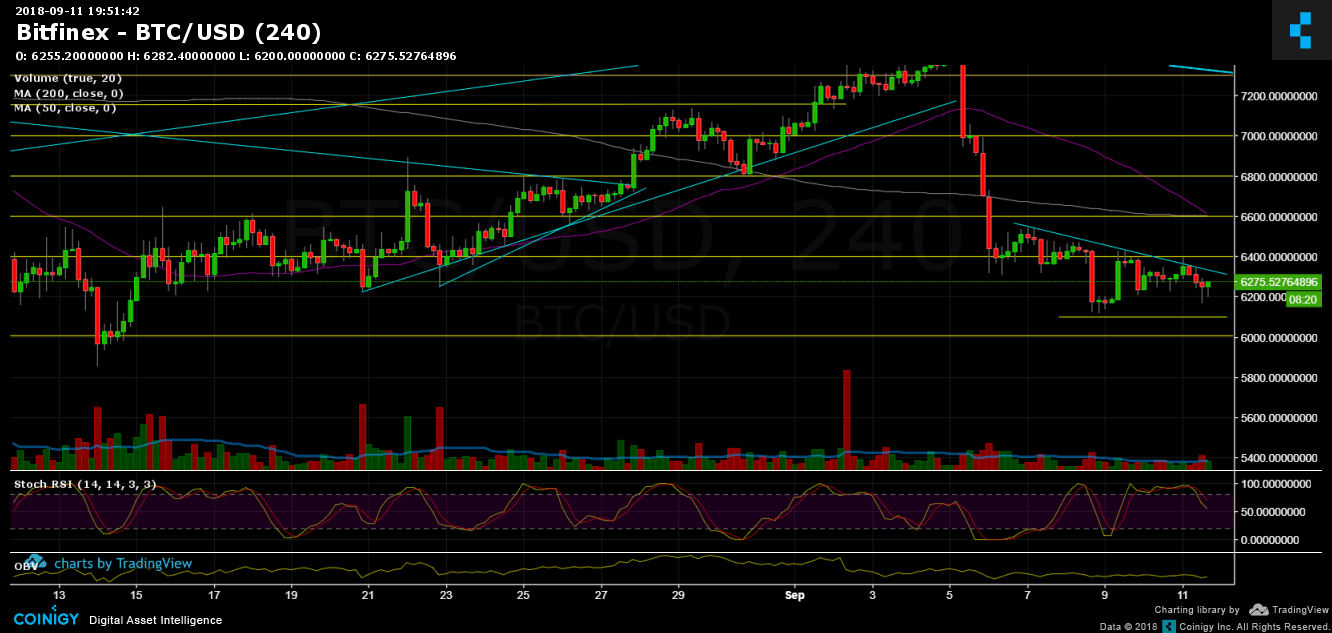
Over the past five days there is a side way action between $6100 to $6400, along with a bearish pennant building.
The most likely scenario is of breaking down this pennant, breaking down the $6100 to re-test the yearly low area at $5700 – $5800.
This is going to be the fourth time the support area is being tested. Supports tend to weaken as they are tested more and more times. Hence, we could see a massive sell-off to the $5000 area pretty quick if this scenario takes in place.
The bull scenario is, of course, as Bitcoin will hold and a massive short squeeze will shoot Bitcoin to re-test the $6600 major resistance (where moving average 200 and 50 days are meeting – the pink and purple lines) along with strong resistance level.
Until then, cautious is needed when trading the unexpected Bitcoin market.
For the short term:
Resistance area at $6300 – $6400 (descending trend line) and as mentioned $6600 strong resistance.
Support areas: $6100, $6000, $5700 – $5800.
Bitcoin Prices: BTC/USD BitFinex 4 Hours chart
Cryptocurrency charts by TradingView. Technical analysis tools by Coinigy.


Article comments