Bitcoin Price Analysis Oct.2: Quiet Before the Storm?
Over the past year, it has been very rare that Bitcoin’s volatility is calm. It looks like Bitcoin’s range is getting tighten and tighten, till the triangle will breach out to either direction and produce a significant move.
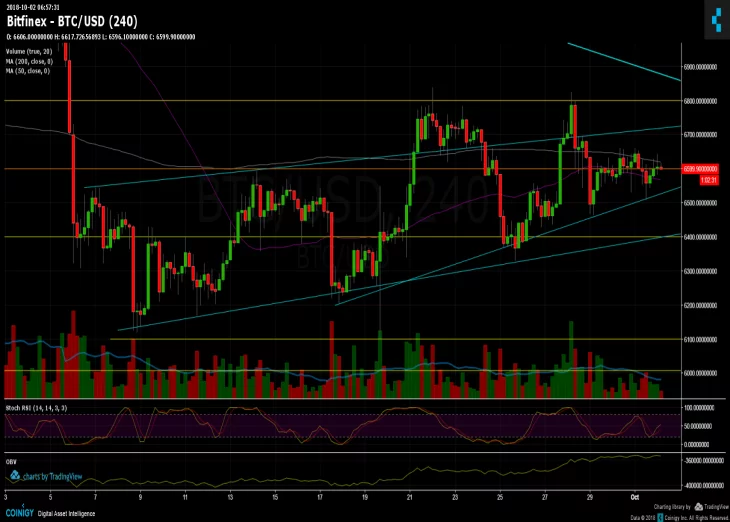
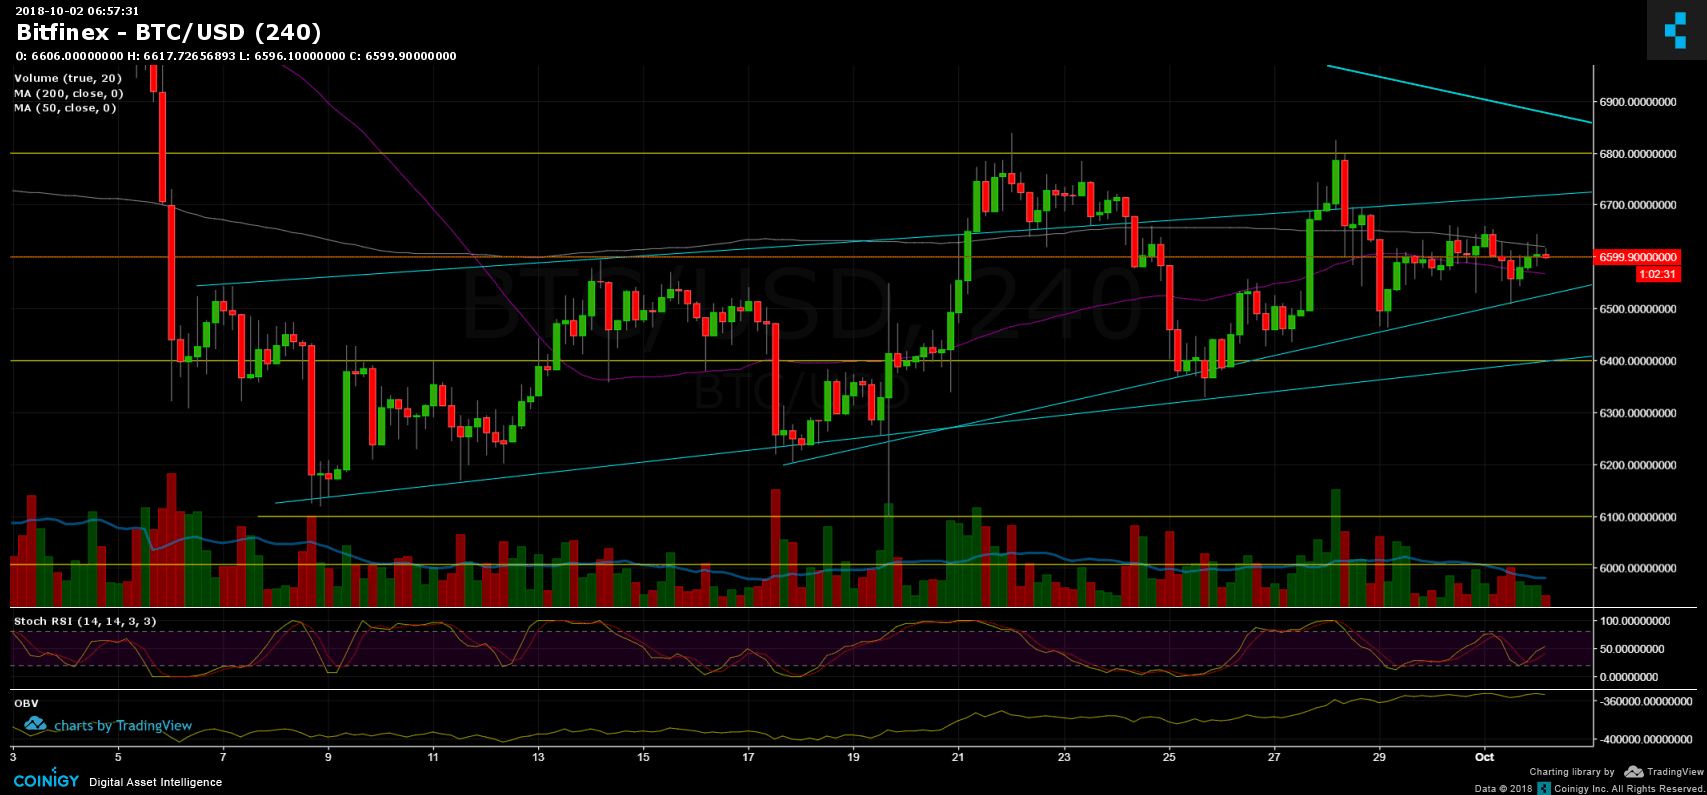
The movement is exactly between the two moving average lines that we are following: the 50 days (purple line on the chart below) and the 200 days (pink).
Now what?
Bitcoin Prices: BTC/USD BitFinex 4 Hours chart
Cryptocurrency charts by TradingView. Technical analysis tools by Coinigy.


Support this Site


Article comments