Bitcoin Price Analysis Nov.29: The Correction Continues But Keep Your Eye on the RSI

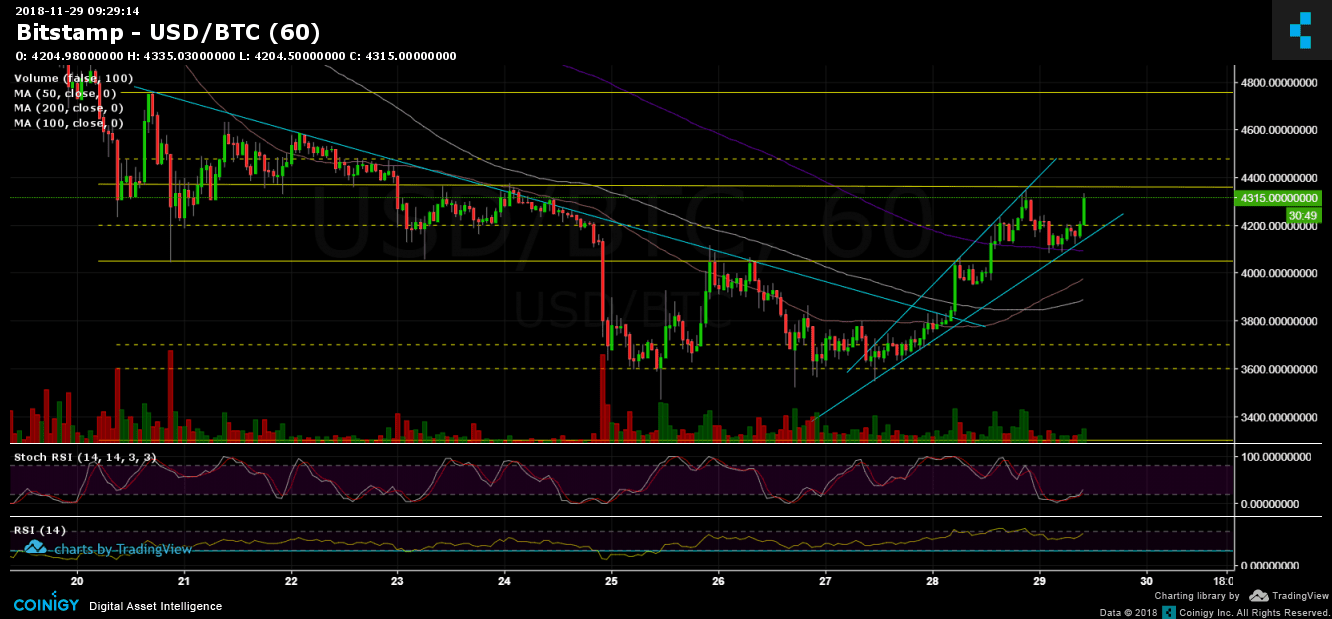
After breaking up the $4K area, Bitcoin had soared to a current high of $4355 (Bitstamp). This marks a correction of 25% from the yearly low that was seen just two days ago. As mentioned before – a violent move to one side carries violence to the other side. This is exactly what we see now.
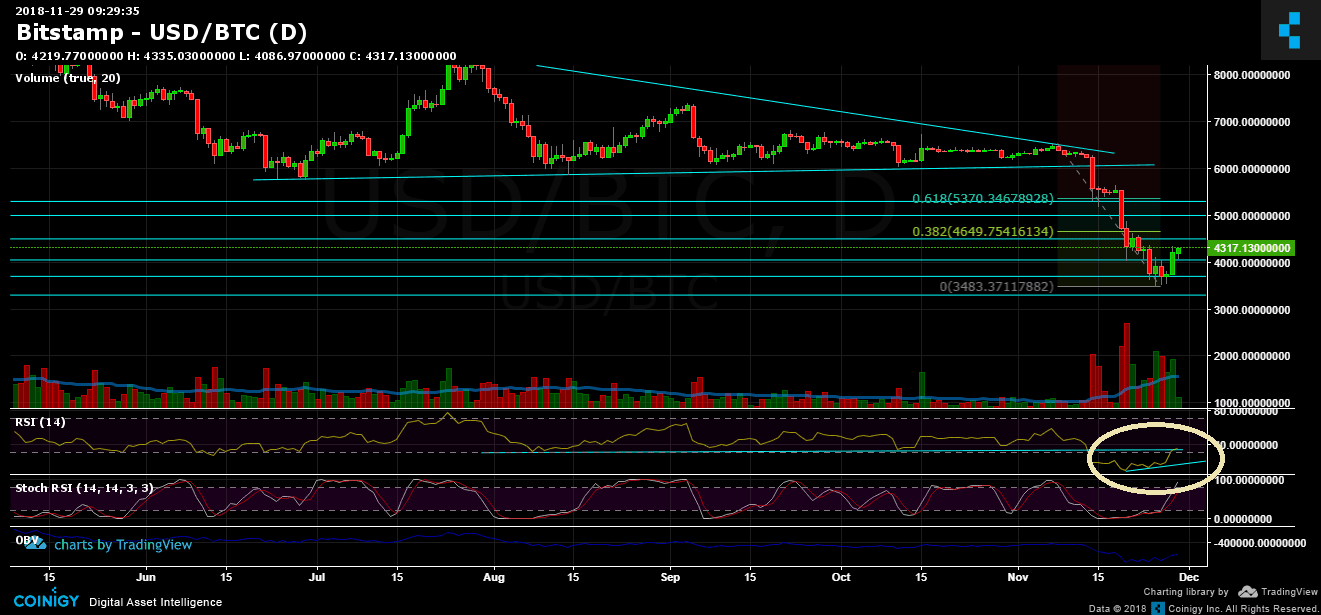
Is the bear market over yet? Are the bulls back? It’s too early to say. By looking at the bigger picture, I would want to see Bitcoin breaches the $4700 and the $5400 areas, which are Fib retracement levels of the significant decline ($6500 down to $3500).
Looking at the 1-day & 1-hour charts
BTC/USD BitStamp 1-Hour chart
BTC/USD BitStamp 1-Day chart
Cryptocurrency charts by TradingView. Technical analysis tools by Coinigy.


Support this Site


Article comments