Bitcoin Price Analysis Nov.21: Another low has been captured, what’s next?
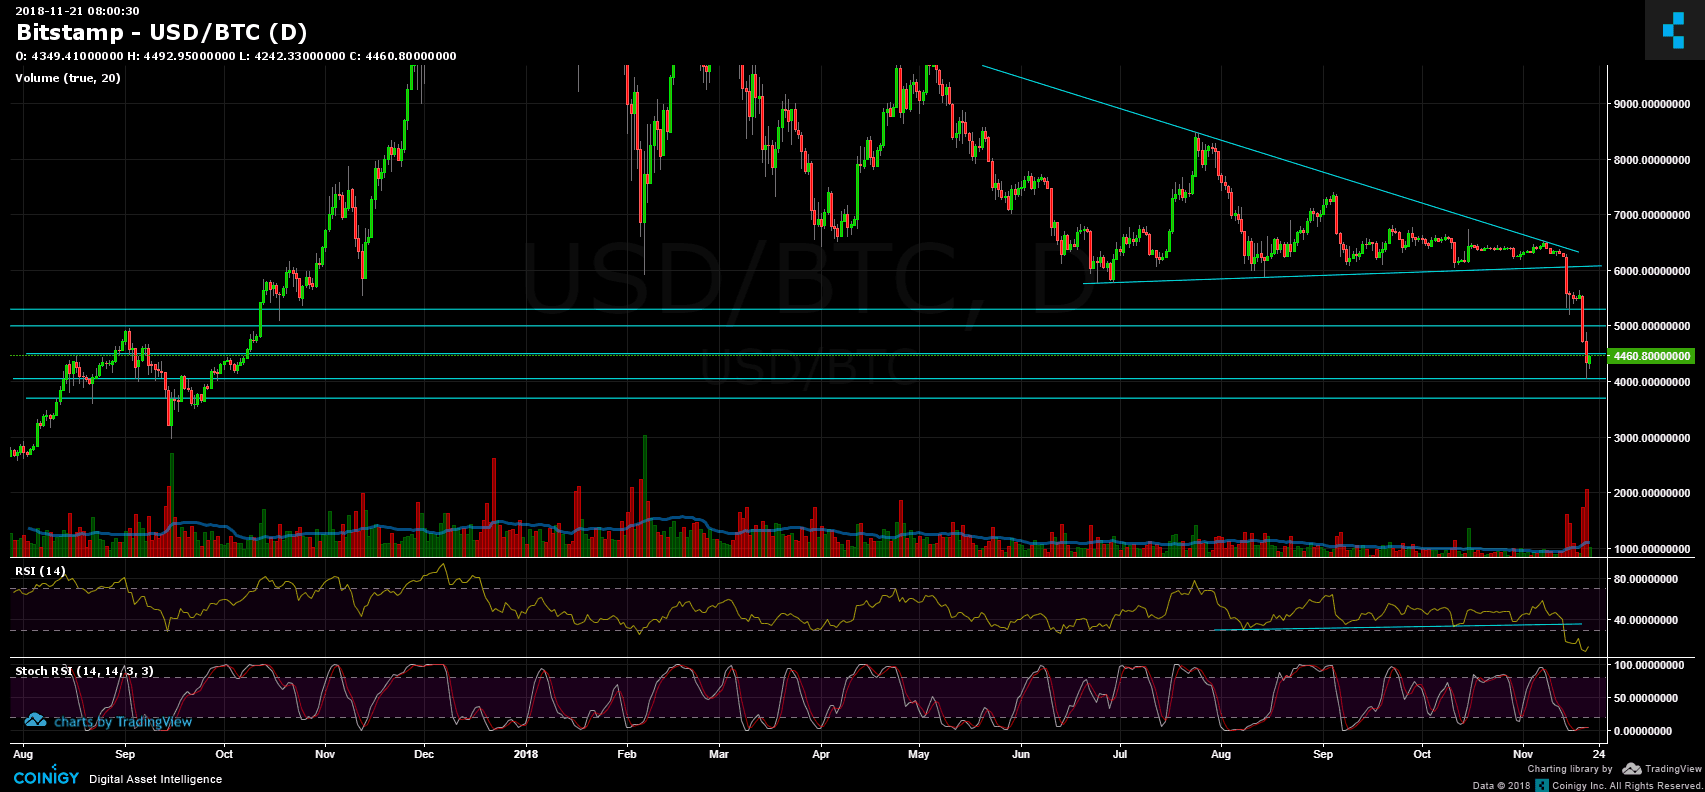
Unfortunate to all Bitcoin lovers, another low was captured. To whoever whose reading my BTC price analysis from yesterday, I stated there clearly that breaking the $4500 support level means that the next target is $4050. As seen by the following chart, Bitcoin’s yesterday’s low (actually the yearly low) is precisely at $4048.
Getting there, a slight correction has taken place. For the recent hours Bitcoin is consolidating between the $4200 – $4500 range.
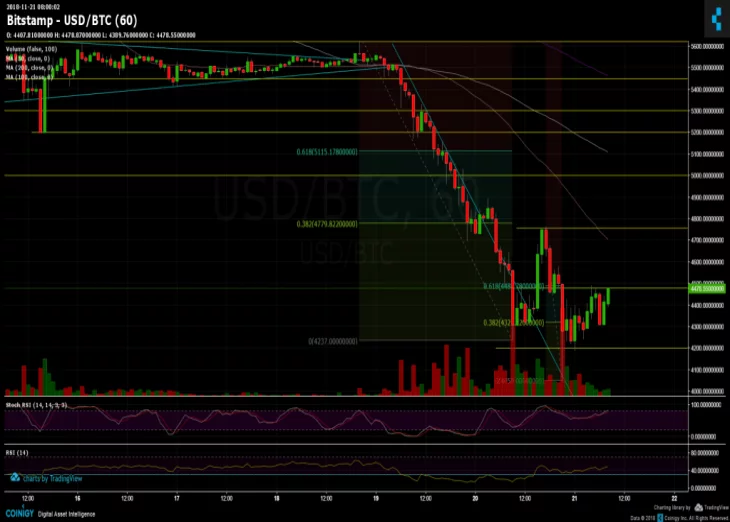
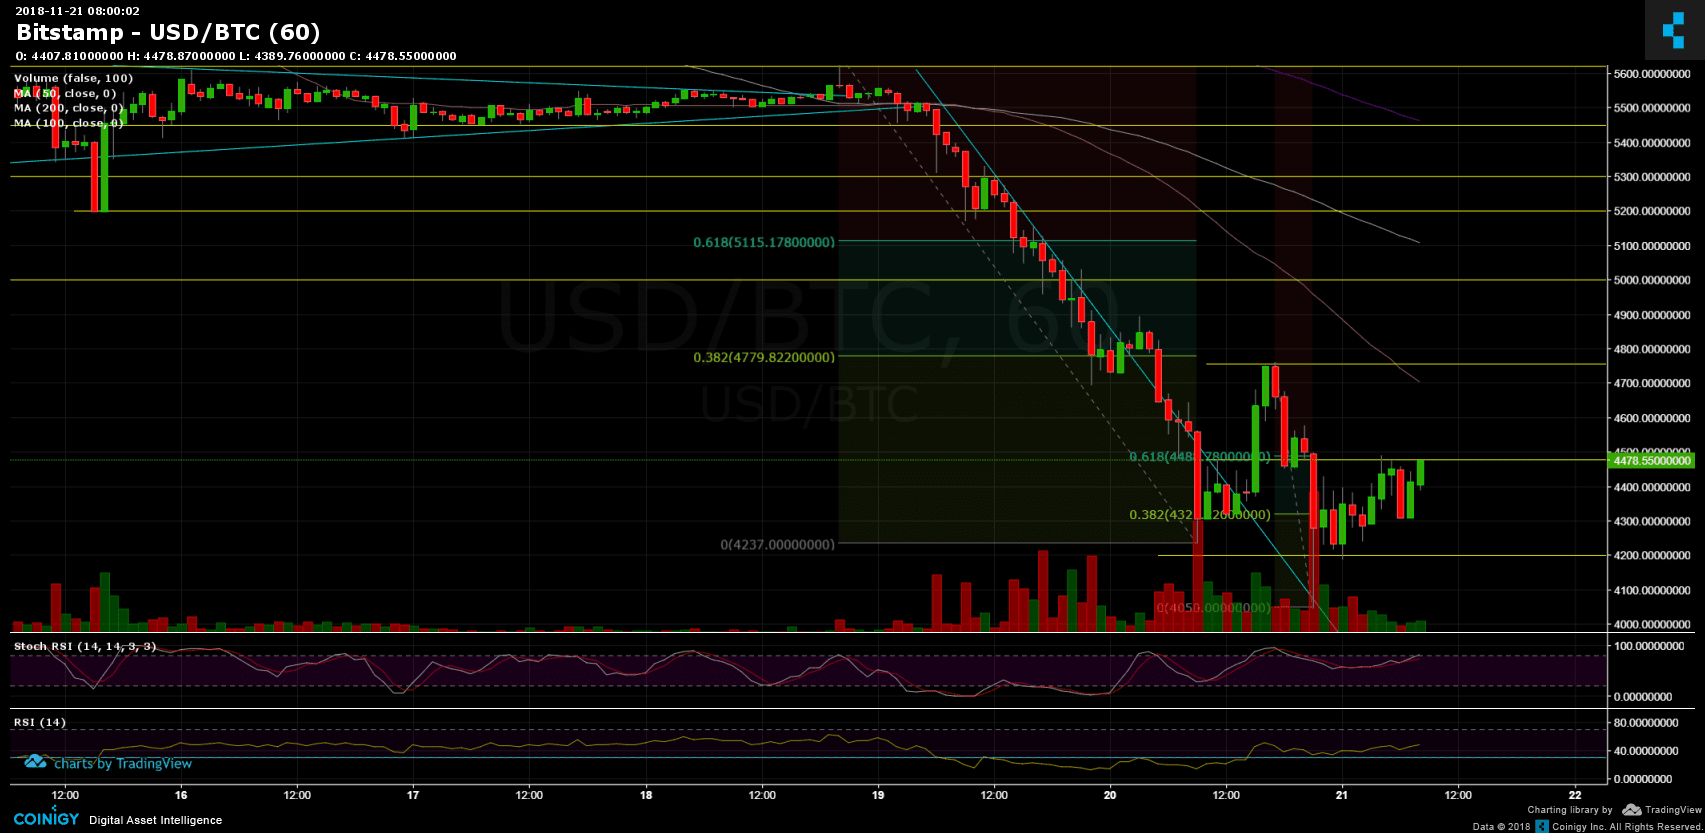
Interesting to notice is that Fibonacci retracement level %61.8 lies at $4488 which is the top boundary of the above range – which is significant resistance. Breaking $4500 support-turned resistance is the first key level for a more substantial correction than what we’ve seen so far.
The fibb level works: As you can also see, so far the downtrend from $5650 to $4250 was corrected exactly up to Fibb level %38.2 at $4750.
Looking at the 1-day chart & 1-hour chart:
BTC/USD BitStamp 1-Hour chart
BTC/USD BitStamp 1-Day chart
Cryptocurrency charts by TradingView. Technical analysis tools by Coinigy.


Support this Site


Article comments