Bitcoin Price Analysis Nov.2: Testing resistance for a possible move up

On our previous analysis, we expected a Bitcoin move. Not long afterwards, Bitcoin broke the tight range it was traded at over the two weeks between October 15 and October 29. While the stock markets are going crazy, Bitcoin is the new “stable coin”.
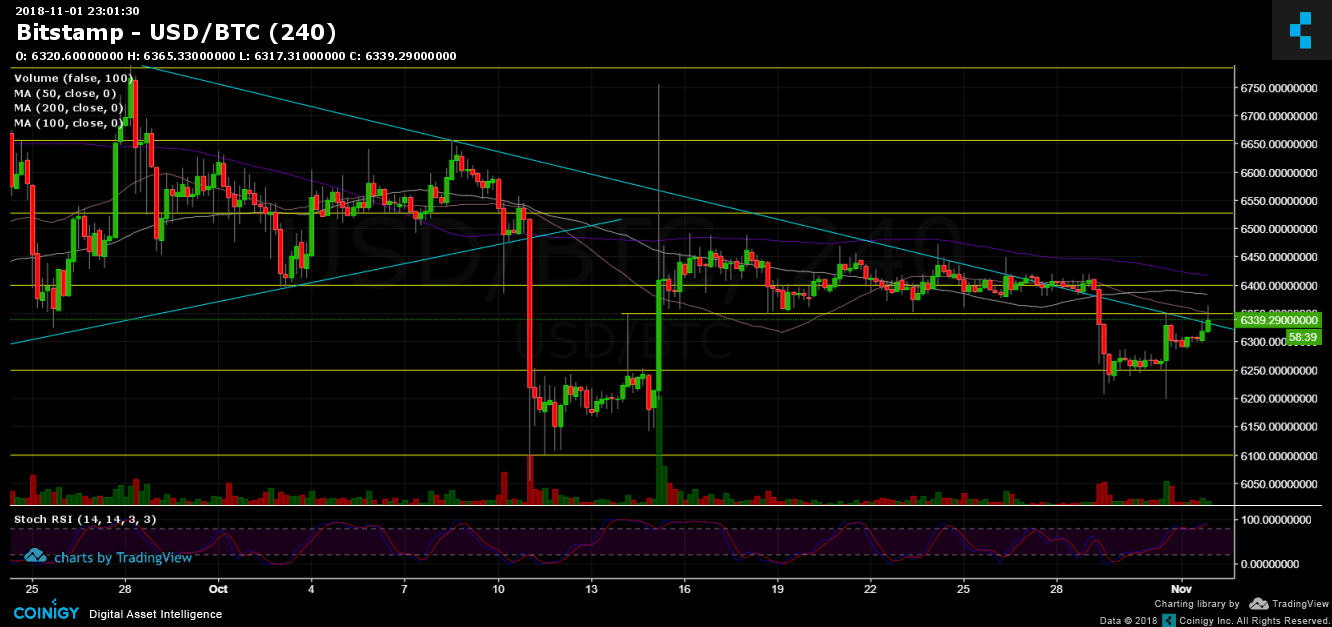
The move (down) broke the tight range with an immediate target of $6200 that was reached very quickly. Since then, Bitcoin made a slight correction up, while its volatility and trading volume decreased again.
Now What?
BTC/USD BitStamp 4 Hours chart
Cryptocurrency charts by TradingView. Technical analysis tools by Coinigy.


Support this Site


Article comments