Bitcoin Price Analysis Nov.19: Bleeding to $5K, or a double bottom?
Following the in-depth analysis from yesterday and as mentioned before, Bitcoin is under bearish conditions or at a stage known as Capitulation.
Capitulation sounds positive (as the last market cycle) even though it can take the asset to far new lows. We remind our long-term prediction.
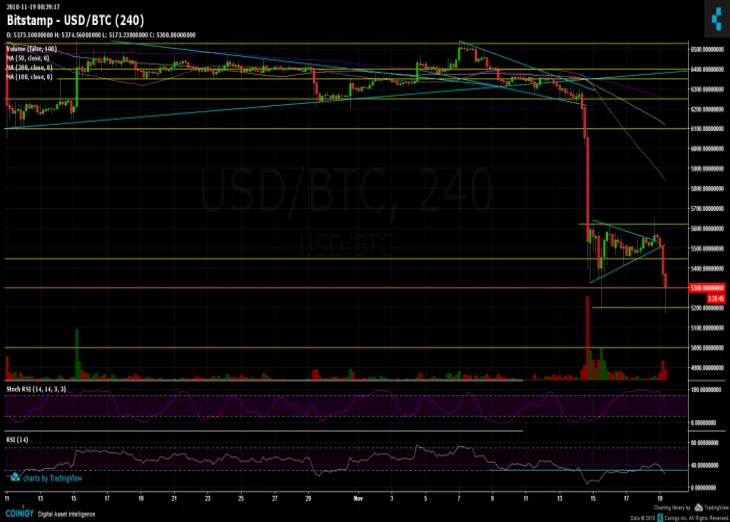
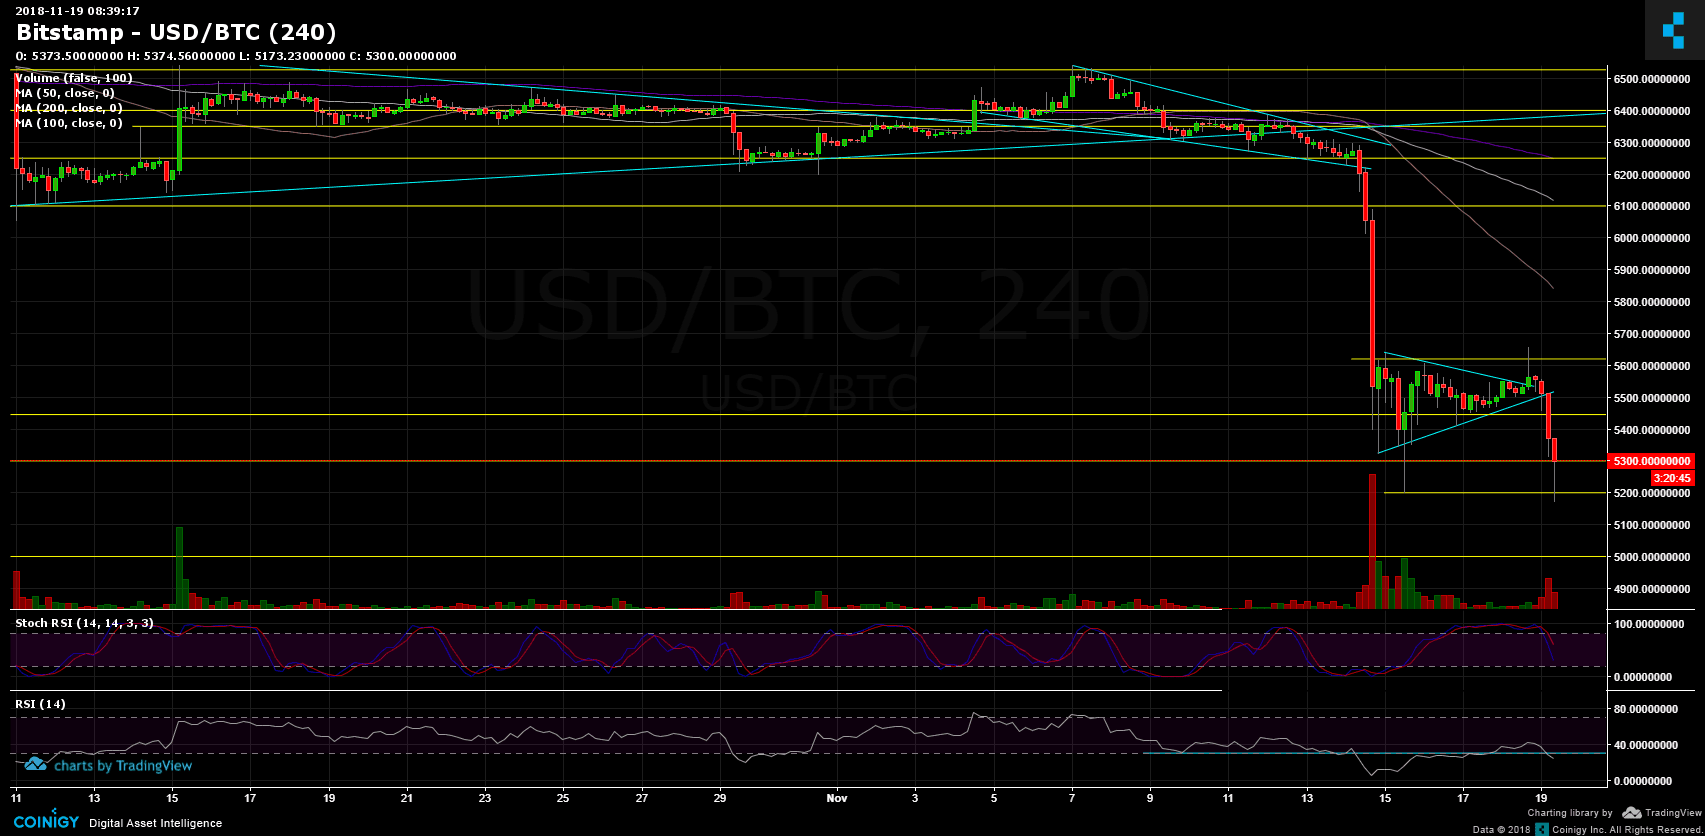
From yesterday’s analysis: “Zoom in to the current’s situation: Bitcoin is forming a symmetric triangle which it’s getting tighter and expected to break. In my opinion, the higher the chance is a breakdown. The next support area lies around $5450 and $5300.”
As we can see on the following chart, the triangle was broken down. The support level at $5300 has held for a bit, but then (during the recent hours and as I write this) another red candle came across to re-test the yearly low from November 15 at $5200 (Bitstamp).
Looking at the 4-hour chart:
BTC/USD BitStamp 4-Hours chart
Cryptocurrency charts by TradingView. Technical analysis tools by Coinigy.


Support this Site


Article comments