Bitcoin Price Analysis Jan.7: BTC Is Over $4000 Following Triangle’s Breakout
On our previous BTC price analysis from two days ago, we mentioned the sideways action along with the anticipated move:
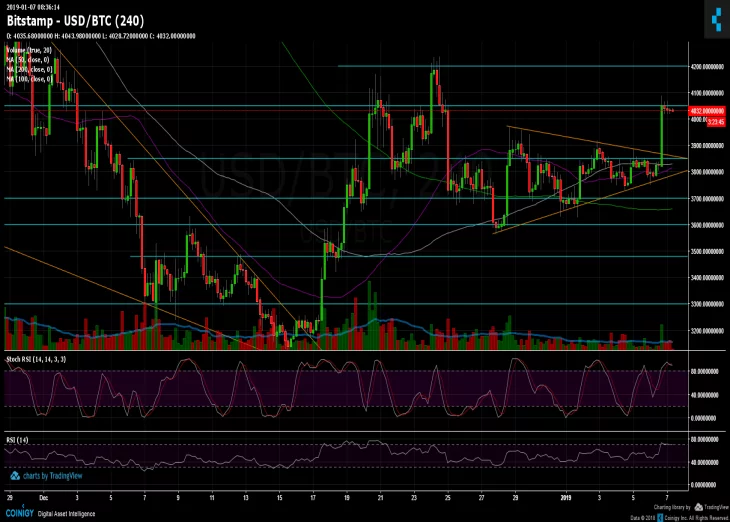
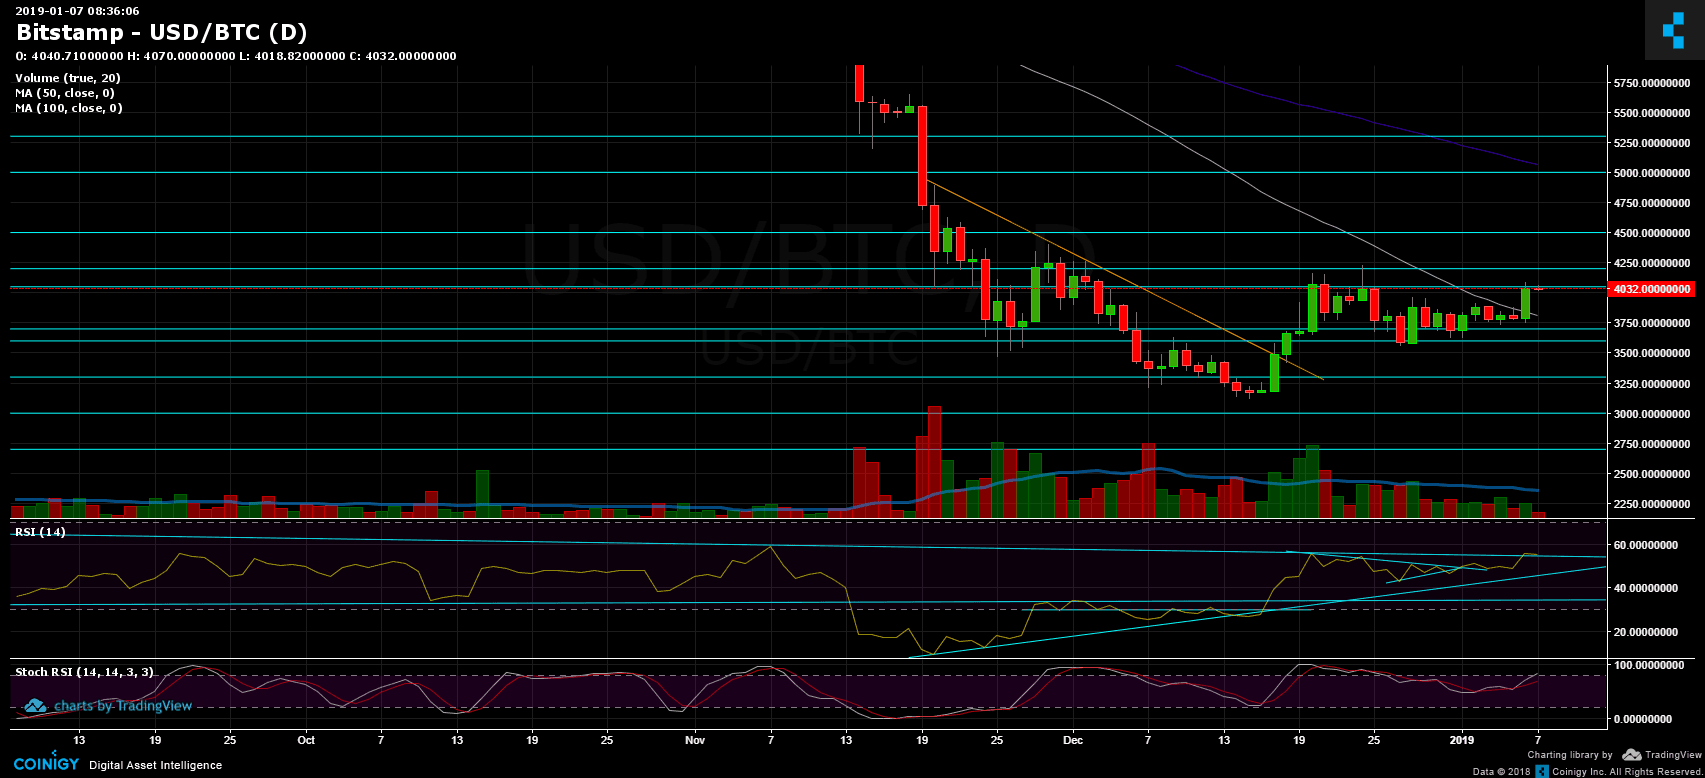
“The triangle should be decided along with the interaction with the significant resistance level of the 50-days moving average line from the daily chart (marked in white). A breakout could turn out to be a very bullish move and send Bitcoin to retest next resistance levels around the $4050 – $4200 area. The following resistance level is $4400.”
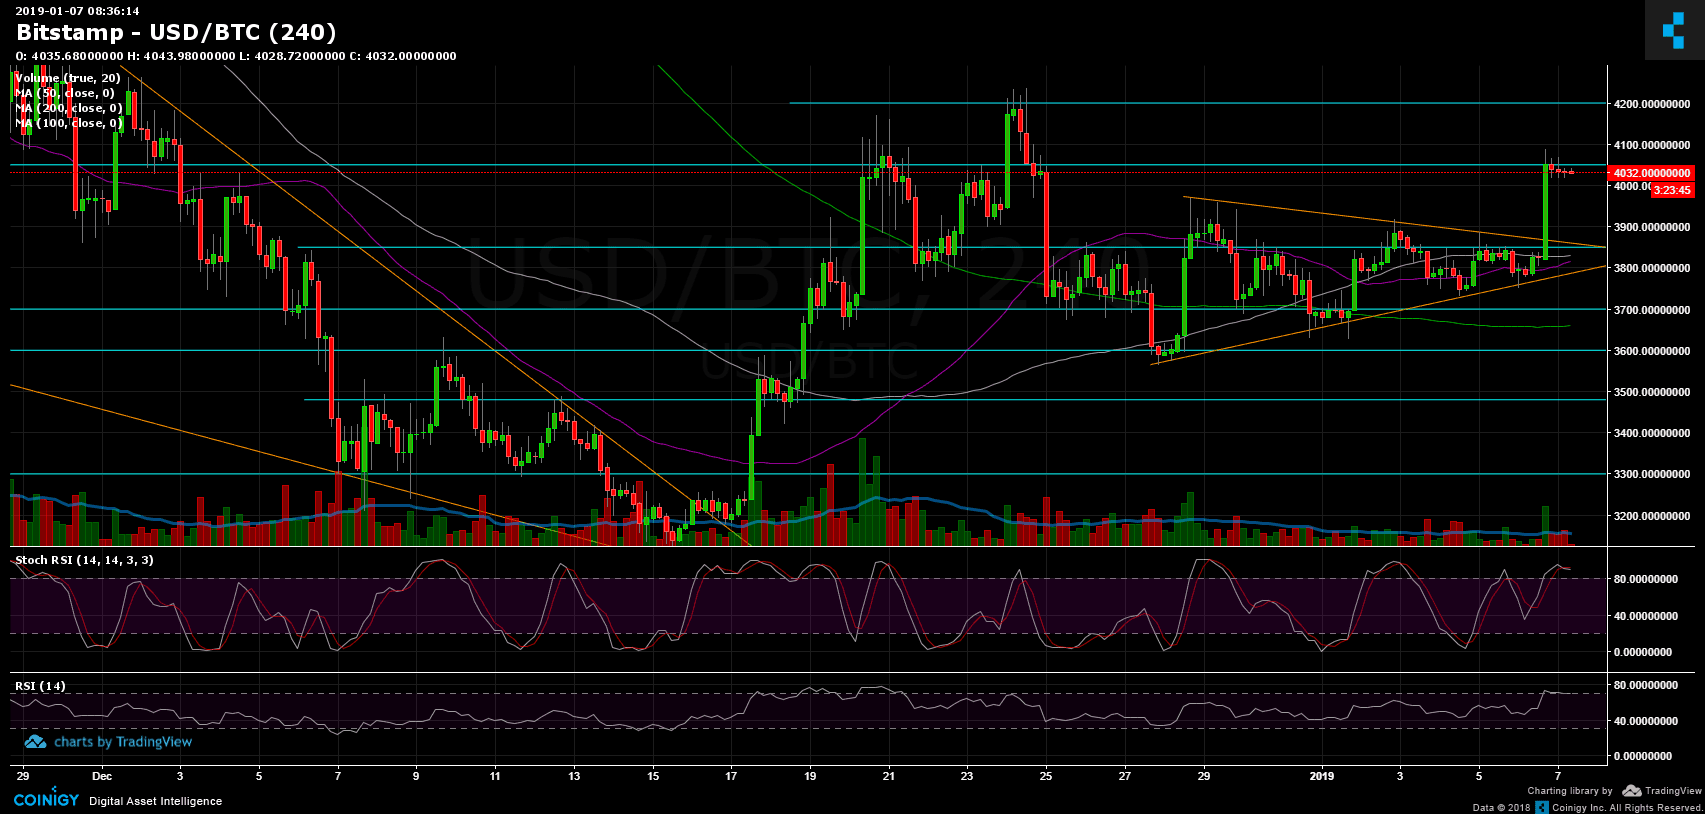
As we can see, the described scenario took place, with Bitcoin reaching a 24-hours high of $4090 (Bitstamp) as of now, following a decent breakout of the symmetric triangle along with the 50-days moving average line (from the 1-day chart).
Looking at the 1-day & 4-hour charts
BTC/USD BitStamp 4-Hour chart
BTC/USD BitStamp 1-Day chart


Support this Site


Article comments