Bitcoin Price Analysis Jan.1: New Year, New Hopes for BTC
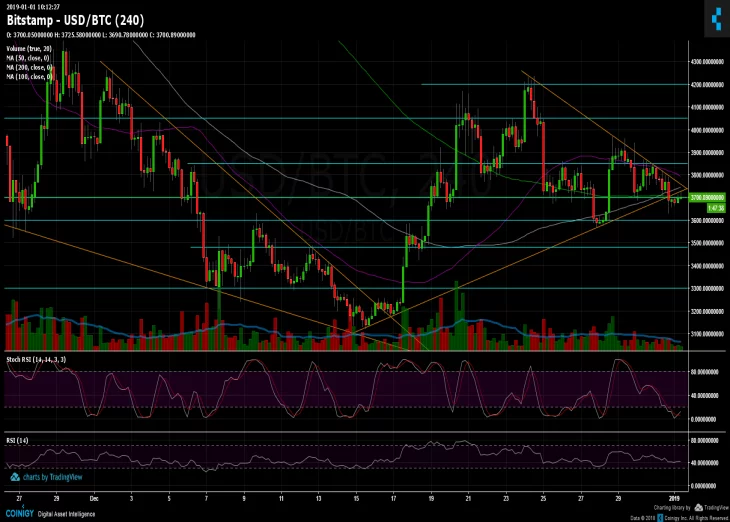
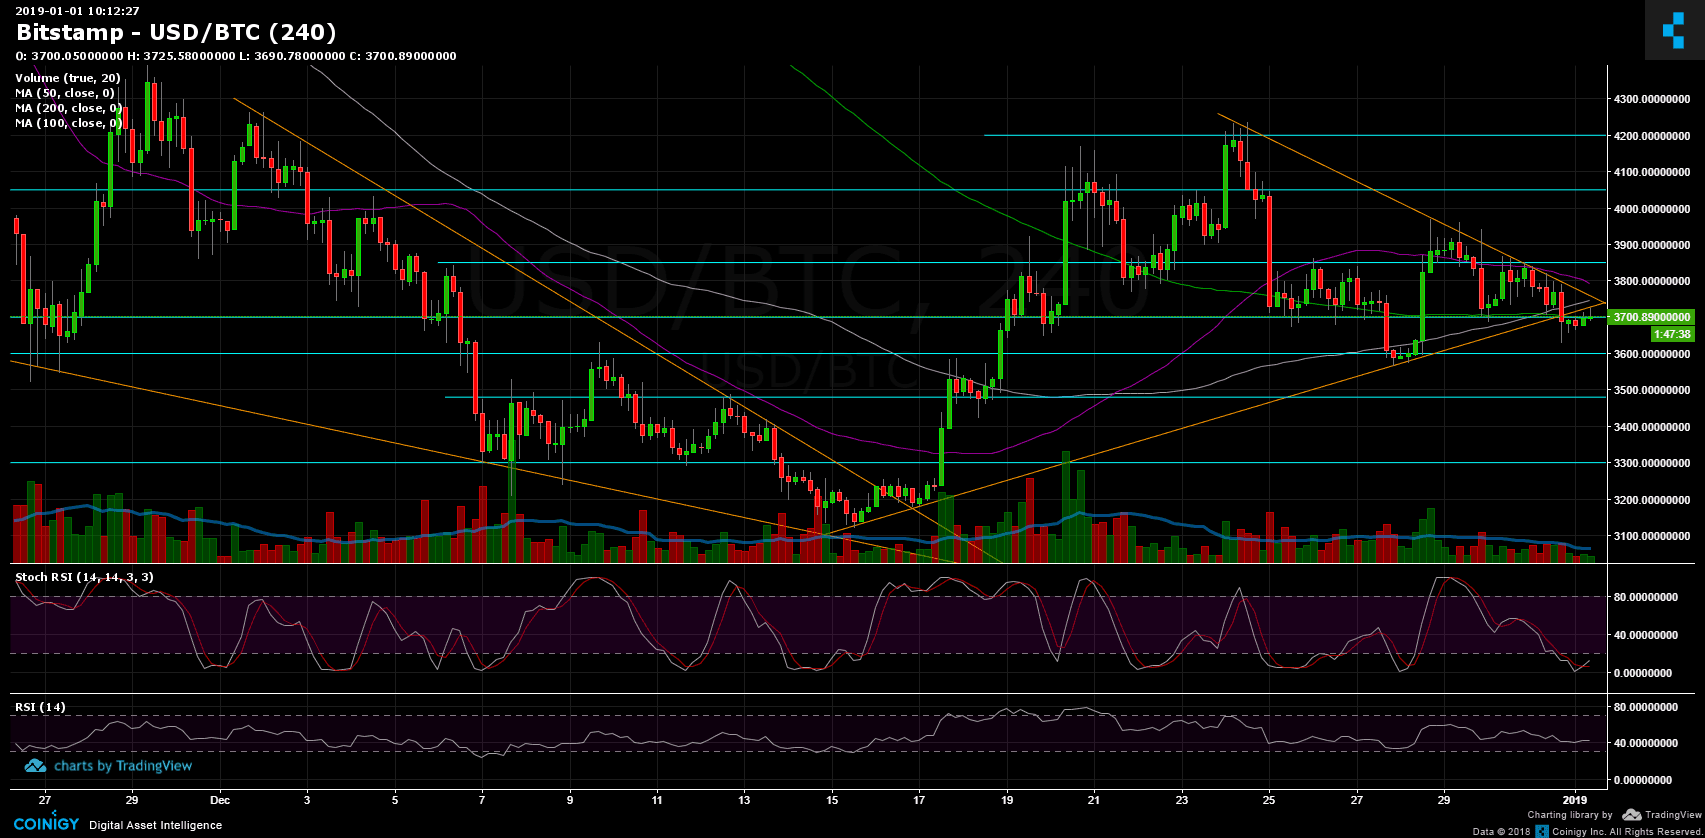
Since our previous BTC price analysis from two days ago, Bitcoin had created two lower highs around the support-turned resistance levels at $3850 and $3800.
From there, Bitcoin had a significant drop to a new 2-day low at $3630, breaking down the mid-term ascending line (marked in orange on the 4-hour chart). As can be seen on the chart, Bitcoin broke down a triangle formation, very close to its apex.
Over the past hours, Bitcoin is slowly recovering and currently re-testing the ascending trend-line from below, now as a resistance, along with the $3700 support-turned resistance level.
As the new year of 2019 starts, Bitcoin hopes for a better one than the bearish 2018 which was a terrible year for the crypto coin.
Looking at the 1-day & 4-hour charts
BTC/USD BitStamp 4-Hour chart
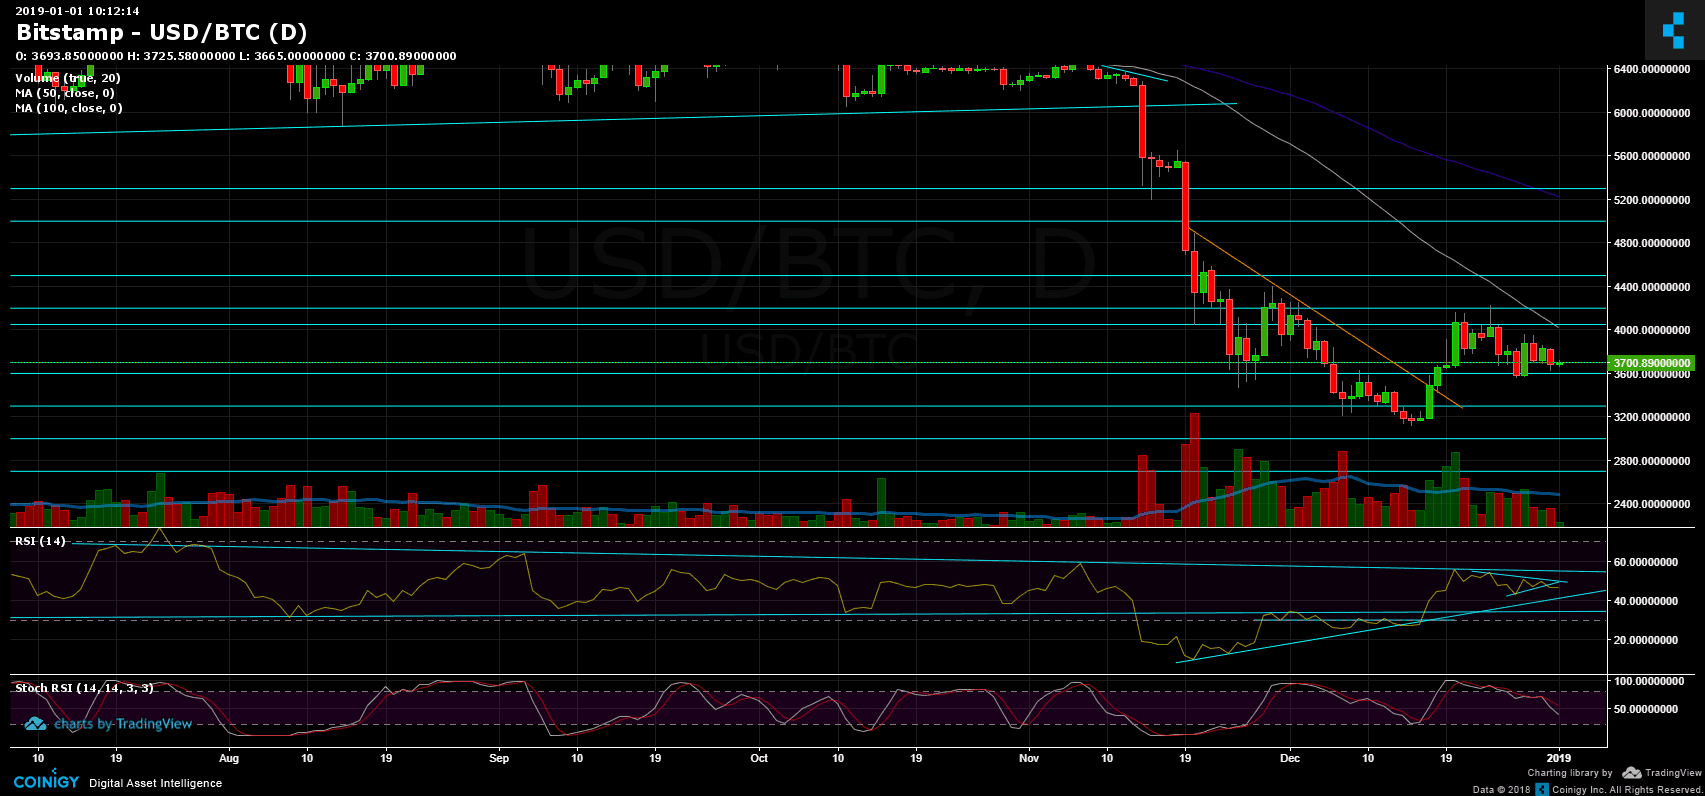
BTC/USD BitStamp 1-Day chart


Support this Site


Article comments