Bitcoin Price Analysis Dec.27: BTC Sideways Action Will Breakout Soon?
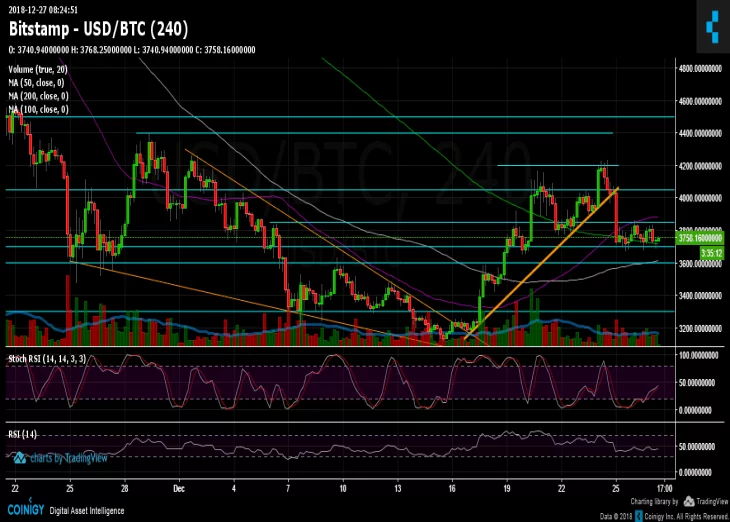
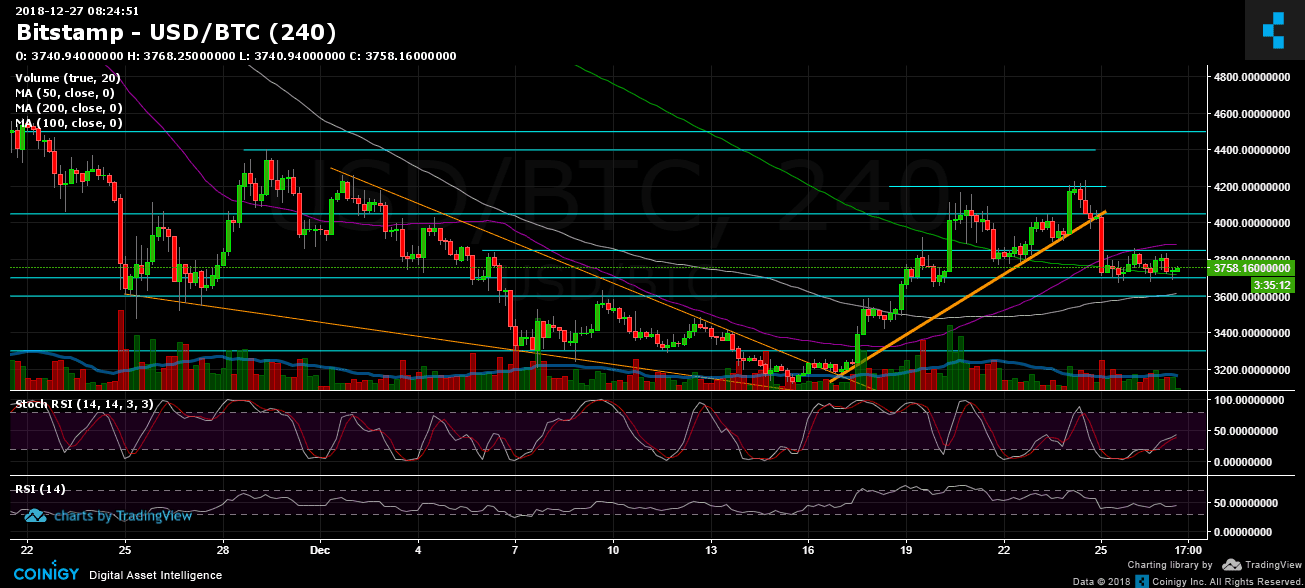
Holidays are well-felt on the crypto charts as both the volume and the volatility are very low. Over the past two days since our recent BTC price analysis Bitcoin is moving sideways between $3700 and $3850, the two levels we have mentioned here as support/resistance.
It turned out that the two above levels correlate with the 50 days moving average line from above (marked purple on the 4-hour chart) and the 200 days moving average line from below (marked in light blue).
We can assume that as the holiday’s mood disappears, we would see some action and a breakout from the above range.
Looking at the 1-day & 4-hour charts
BTC/USD BitStamp 4-Hour chart
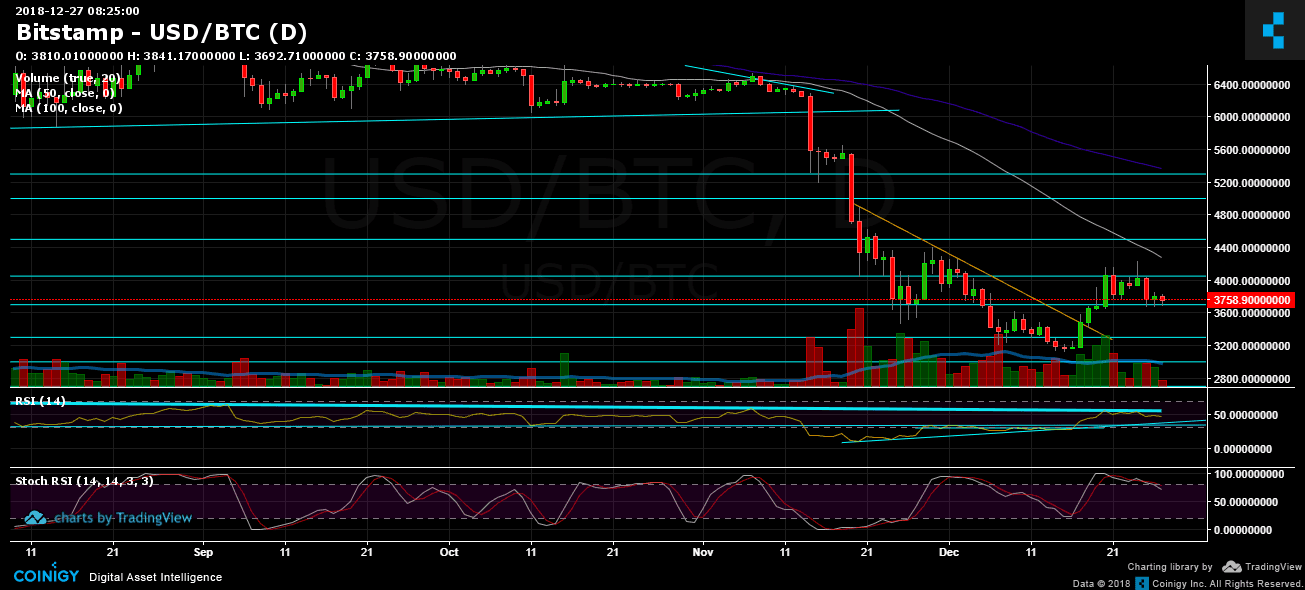
BTC/USD BitStamp 1-Day chart


Support this Site


Article comments