Bitcoin Price Analysis Dec.22: Is It Just a Healthy Correction, Or Back Down?
Since our previous BTC price analysis and as anticipated, Bitcoin had trouble breaking up the $4050 – $4100 resistance area.
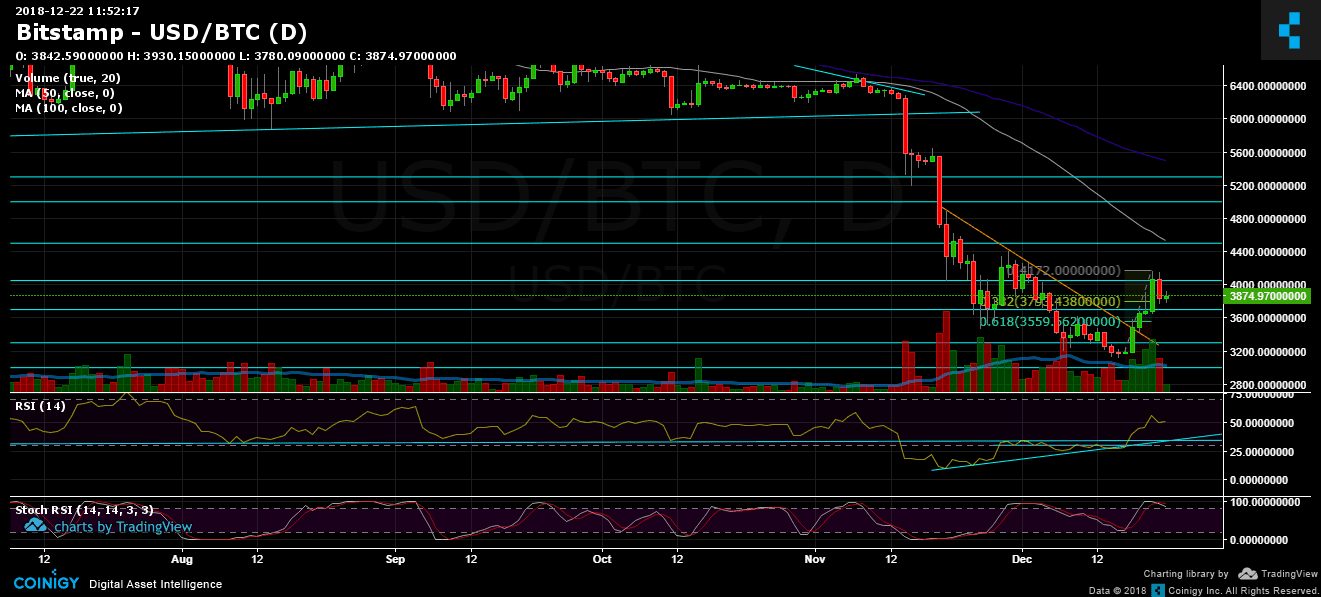
Failing to break had led to a regression or correction and Bitcoin collapsed almost $400 to a daily low of $3770 (Bitstamp).
So far, this looks like a healthy correction following the 30% gain in three days. The correction had reached the 38.2% Fibonacci retracement level (marked on the attached daily chart) – around ~$3800.
Another reason for the correction might be the collapsing global markets. This December is so far the worst December since 1931. Wall Street fell 6-8% percent over the past week, following an interest rise.
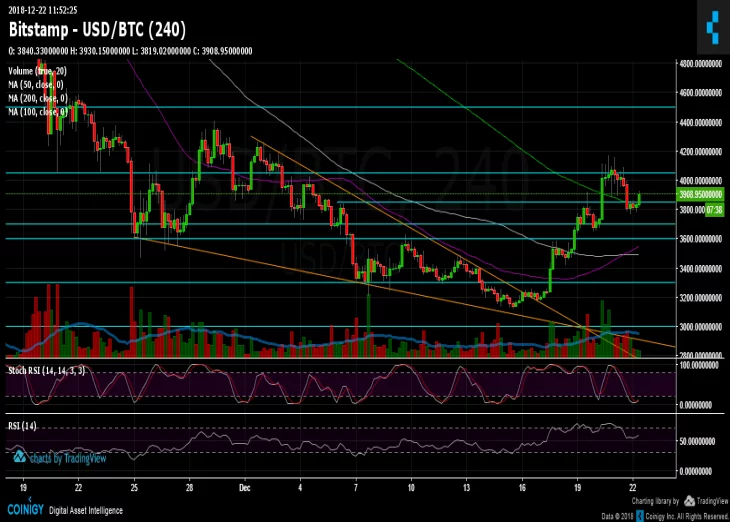
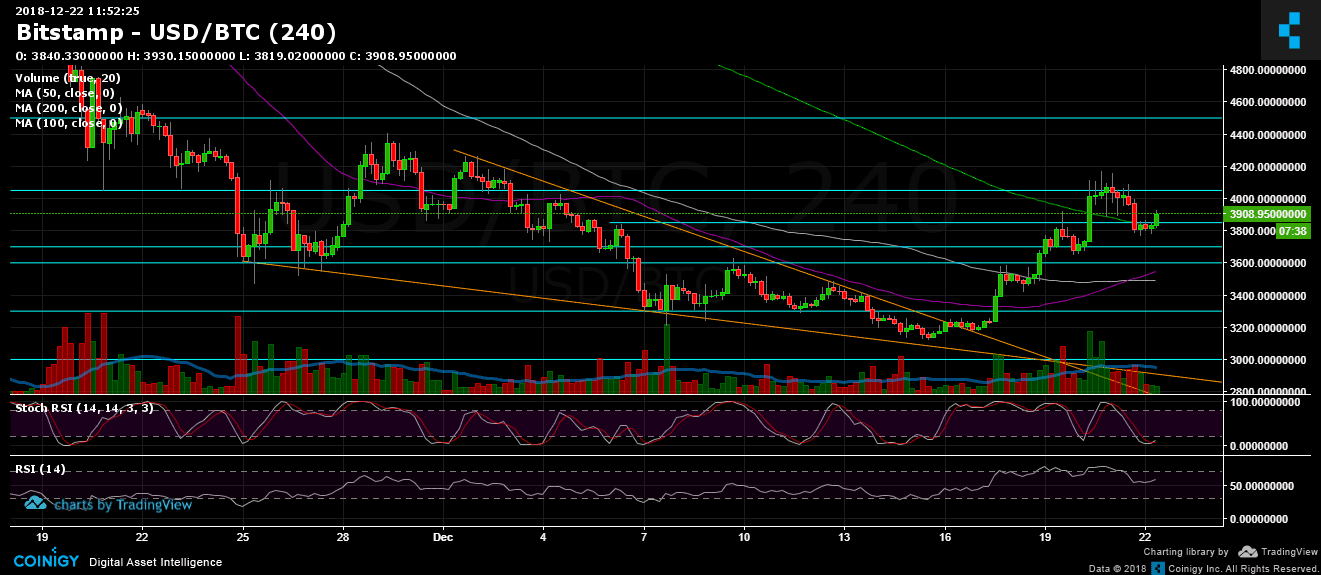
Looking at the 1-day & 4-hour charts
BTC/USD BitStamp 4-Hour chart
BTC/USD BitStamp 1-Day chart
Cryptocurrency charts by TradingView. Technical analysis tools by Coinigy.


Support this Site


Article comments