Bitcoin Price Analysis Dec.11: Tight Range, Is It Time For A Larger Move?

Over the past day, Bitcoin had failed to break through the significant resistance area of $3500 – $3600. If an asset fails to break, it is likely to lose momentum. That’s what happened as Bitcoin marked $3350 as the daily low.
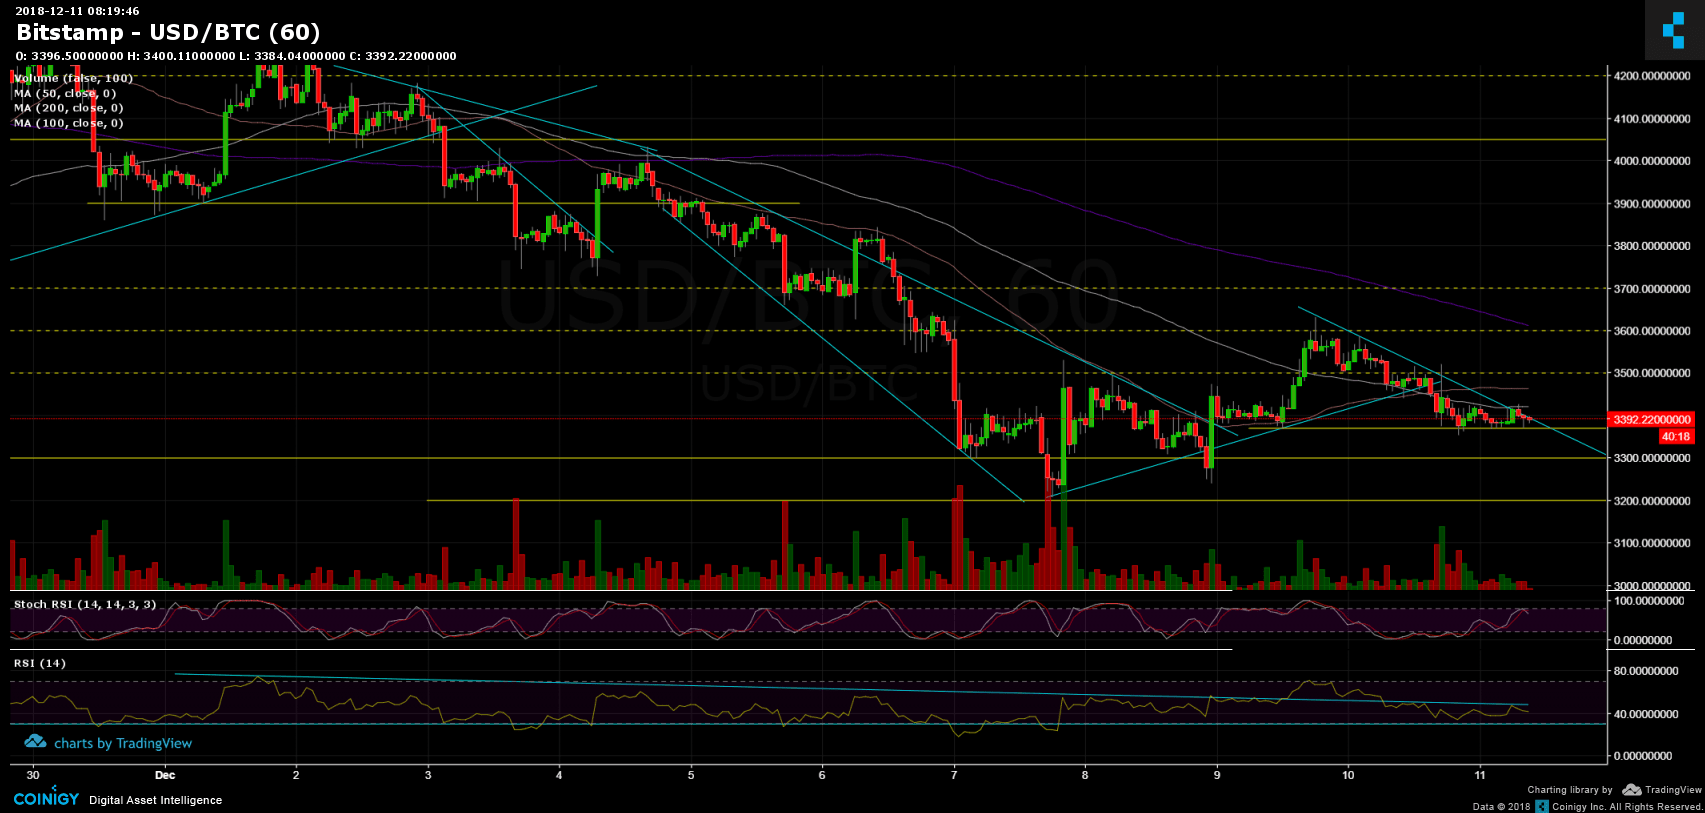
As of now, Bitcoin is consolidating over a tight range between $3370 and $3430 – just underneath the 100 days moving average line (marked in white on the 1-hour chart). This line was supporting Bitcoin yesterday, but now Bitcoin is testing it this time as a resistance.
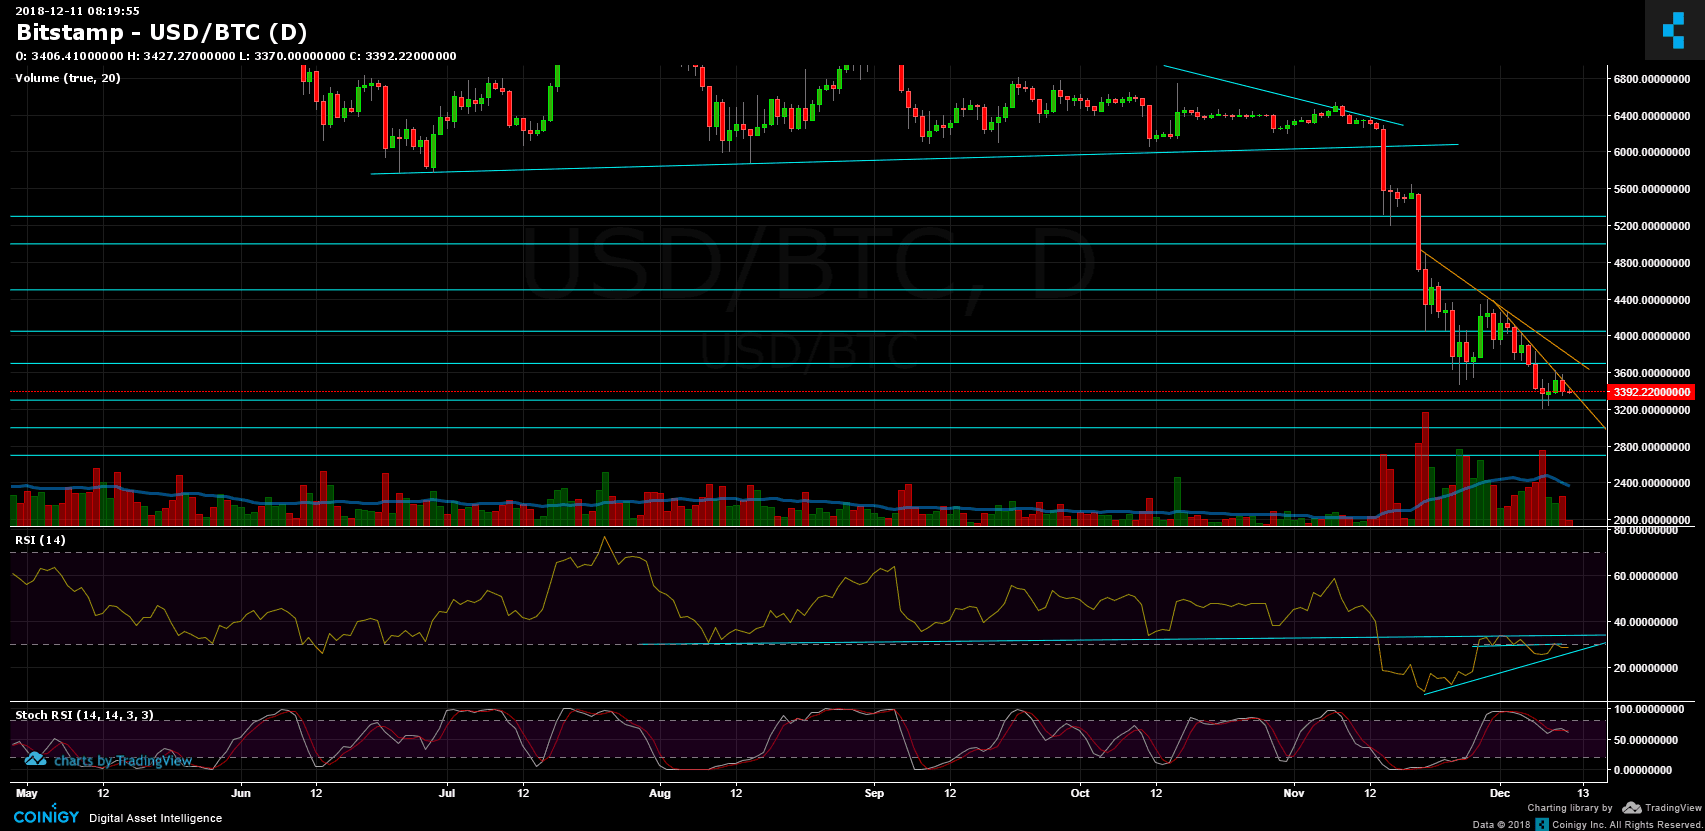
Over the past two weeks, we talked a lot about the importance of the RSI indicator – both in the daily and in the hourly chart. For me, as long as the RSI can’t break up the resistance (on the daily), the market would stay with no buying power.
The above can also be told by looking at the trading volume on the daily candles’ chart. We are still seeing that the sellers’ candles are much higher than the green ones of the buyers’. No market can turn green without buying power.
Looking at the 1-day & 1-hour charts
BTC/USD BitStamp 1-Hour chart
BTC/USD BitStamp 1-Day chart
Cryptocurrency charts by TradingView. Technical analysis tools by Coinigy.


Article comments