Bitcoin Price Analysis August 28
Yesterday $50 worth of Tether USDT was dispatched to BitFinex. This might explain the pump up during the night to test the $7000 zone, as expected on our previous price analysis.
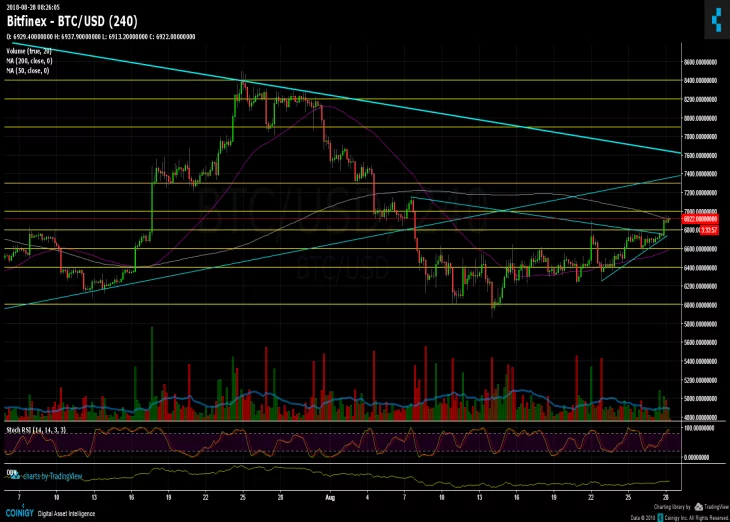
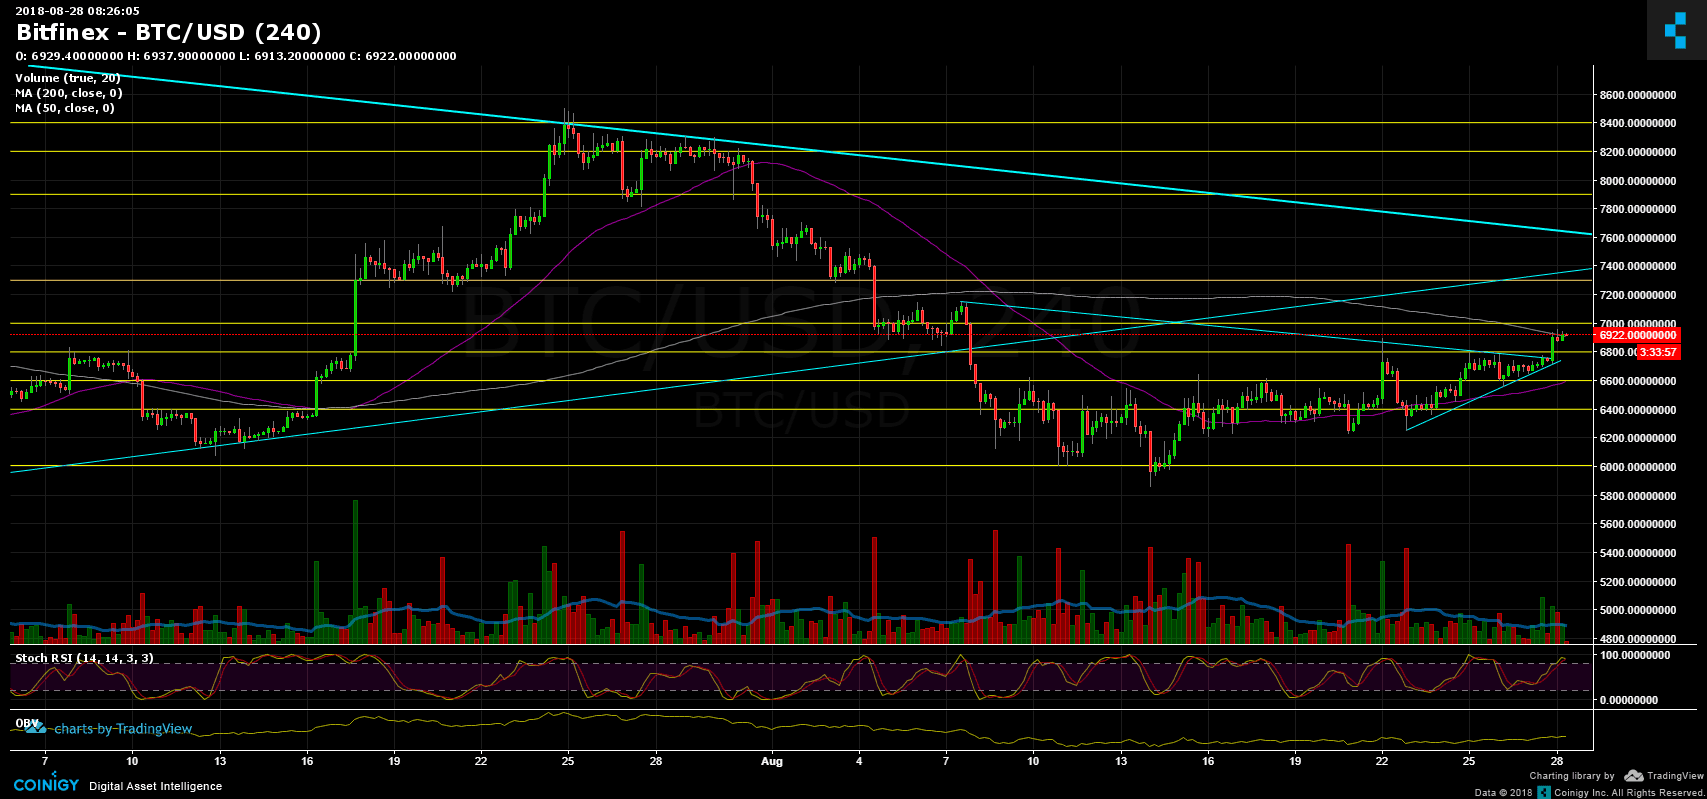
As seen on the chart below, Bitcoin broke up a bullish triangle pattern and is now testing major resistance level of $7000 combined with Moving Average 200 days (the pink line).
RSI levels are at their high – market is overbought, so there might be a correction to re-test support level before testing the $7000 again.
Trading volume is increasing – which is a bullish sign of buyers coming (or a Tether manipulation).
To sum up
Support levels lie at $6800, $6600 (MA-50 – purple line in the chart).
Resistance levels lie at $7000 (strong, MA-200 – pink line), $7250, $7600 (the long-term descending line).
Bitcoin Prices: BTC/USD BitFinex 4 Hours chart
Cryptocurrency charts by TradingView.


Support this Site


Article comments