Bitcoin Price Analysis August 26
Following our last price analysis, the price action over the weekend has been positive. Bitcoin broke up the $6600 level. As we analyzed, the next resistance is the $6800 mark – that’s was the highest level reached. From there, a healthy (as of now) correction back to re-test resistance-turned support level at $6600.
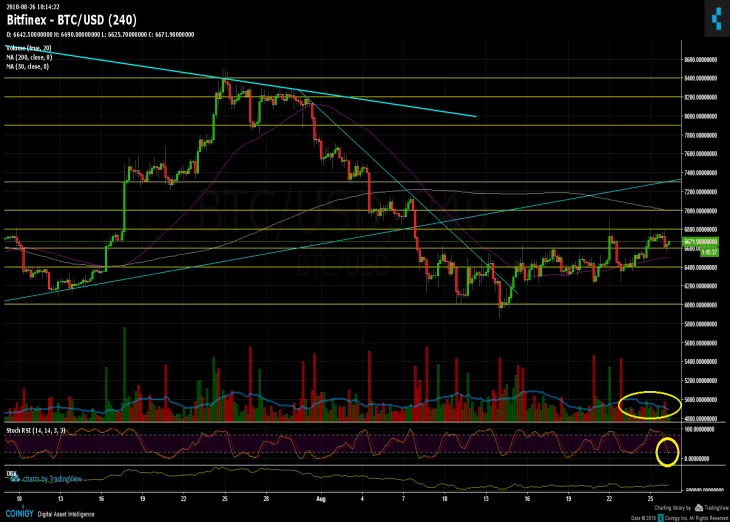
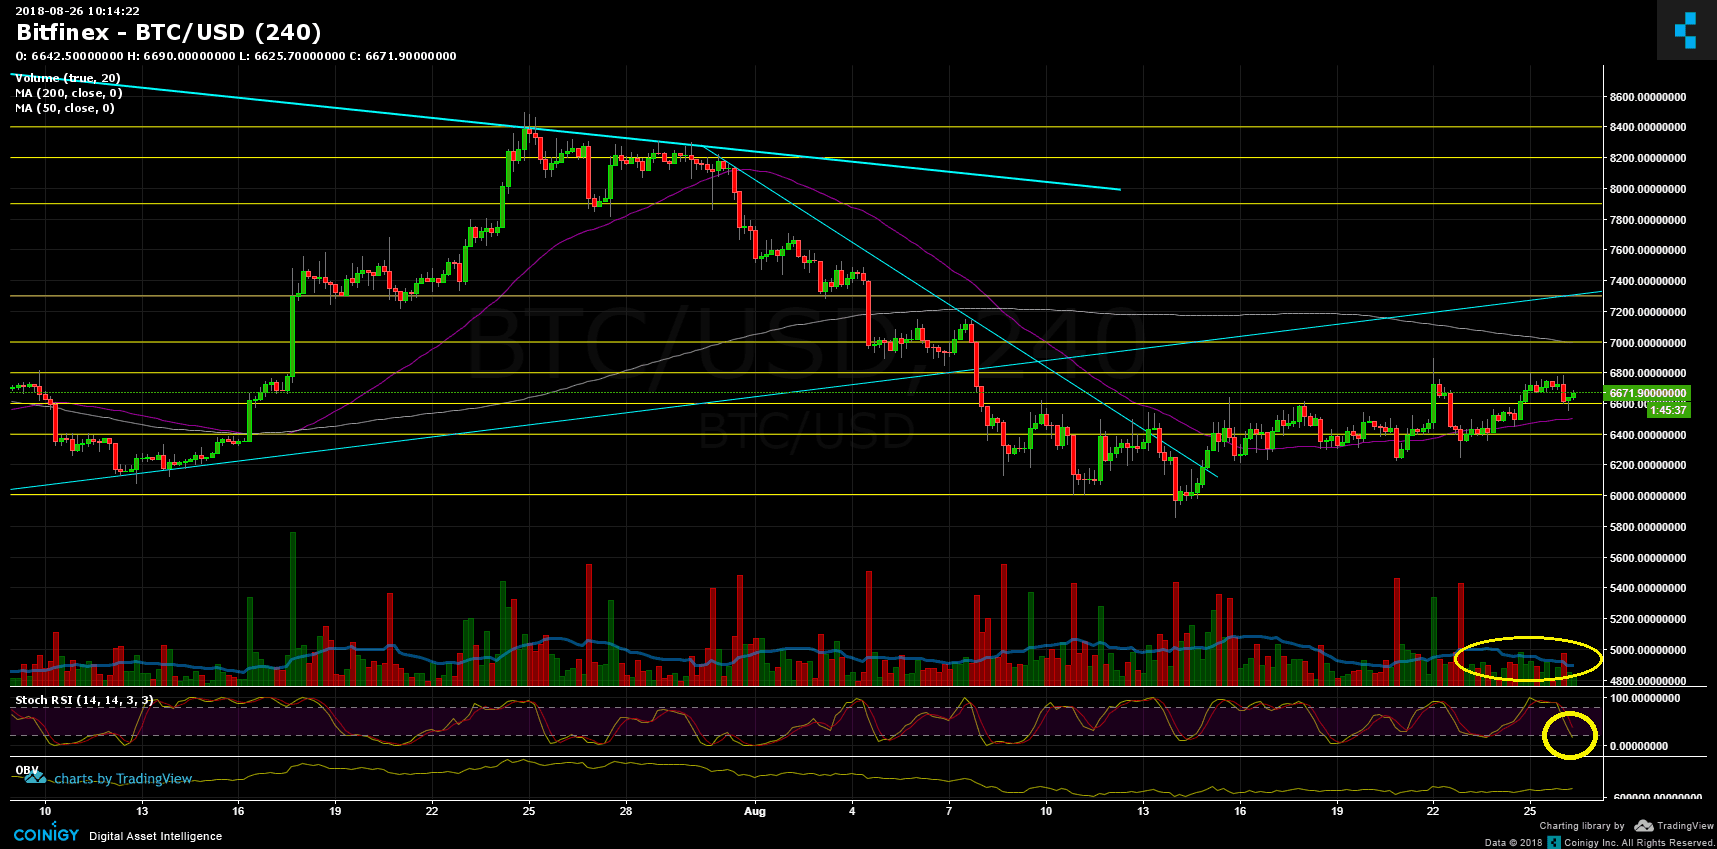
As of writing, a slow stable rise after getting supported by the $6600 level. If this continue like this, we might see Bitcoin soon breaking the $6800 on its way to $7000. The creation of a higher low is very crucial for a positive continuation. RSI levels (marked in yellow circle) are relatively low, which also supports the way up.
What is still missing is a decent buy volumes. Marked in a yellow ellipse on the chart below is the low volume candles. It might be typical to weekend price action, but to see the bulls coming back, a flow of money and buyers will have to appear.
To sum up
Support levels lie at $6600, $6500 (MA-50 – purple line in the chart), $6200 (strong), $6000.
Resistance levels lie at $6800, $7000 (strong, MA-200 – pink line).
Bitcoin Prices: BTC/USD BitFinex 4 Hours chart
Cryptocurrency charts by TradingView


Article comments