Bitcoin Price Analysis August 24
The BitMEX manipulation had ended exactly at the same place it all started from: and Bitcoin is back to the endless range between $6000 – $6600. The recent ProShares ETF rejection by the SEC was indeed already priced, so the rejection itself didn’t lead to a massive selloff, actually the opposite took place (“sell on the news”). During the past days the range had been tighten up to $6200 – $6600.
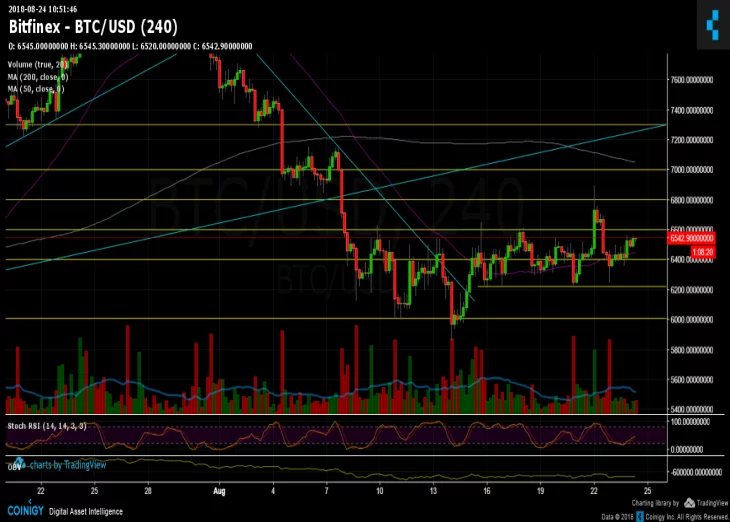
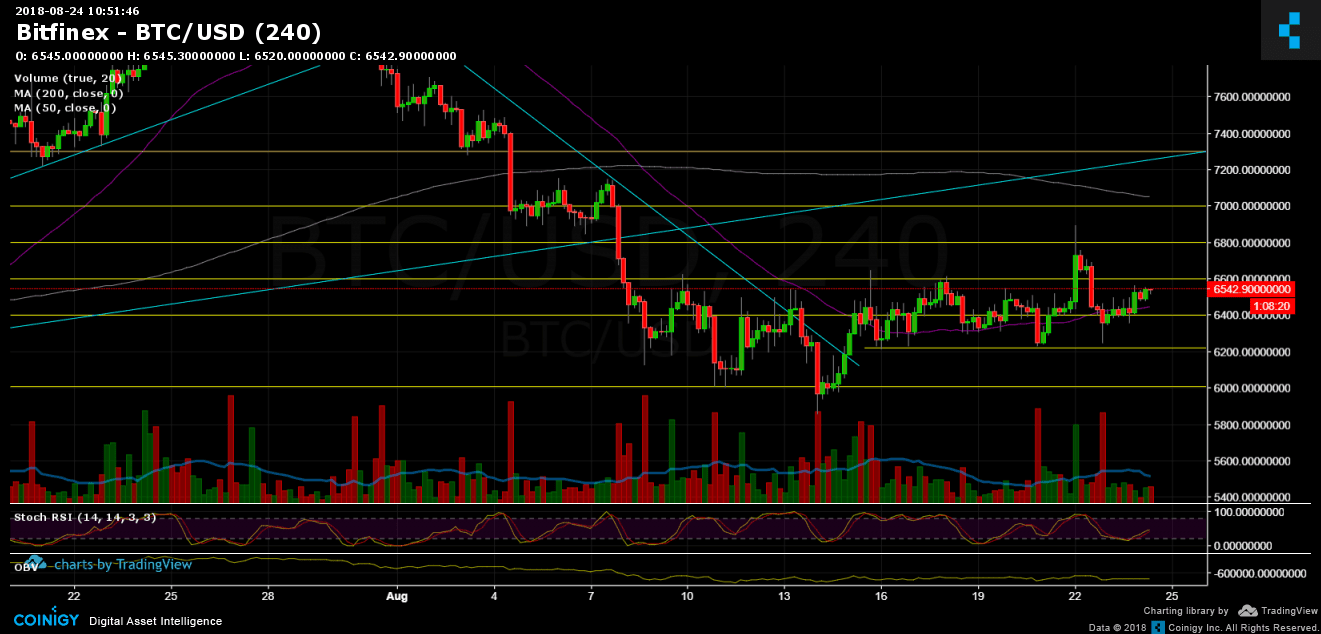
Two things need to take place in order for the market to become bull again: Breaking up of the $6600 level and creating a higher low and then breaking the $7000 area, where lies the Moving Average 200 days (the white line in the following chart).
The amount of short positions is again at its high, what can, in certain circumstances, lead to another short squeeze. But this time, a squeeze that will be followed by enough buy power to breach the two above tough resistance levels.
Overall, the market is still under bearish conditions (until it will prove different). Without new waves of positiveness – it’s likely to see, whether in the next days or weeks, a re-test of the yearly low at $5800.
To sum up
Support levels lie at $6400 (MA-50 – purple line in the chart), $6200 (strong), $6000, $5700 – $5800 (strong, 2018 all-times low).
Resistance levels lie at $6600 (strong), $6800, $7000 (strong, MA-200).
Bitcoin Prices: BTC/USD BitFinex 4 Hours chart


Article comments