Stellar Price Analysis: XLM/USD Trends of November 15-21, 2018

The strong bearish candle that broke down the demand levels of $0.25 and $0.23 and closed below the dynamic support and resistance is an indication that downtrend movements in Stellar price may continue.
Key Highlights:
XLM/USD price Long-term Trend: Bearish
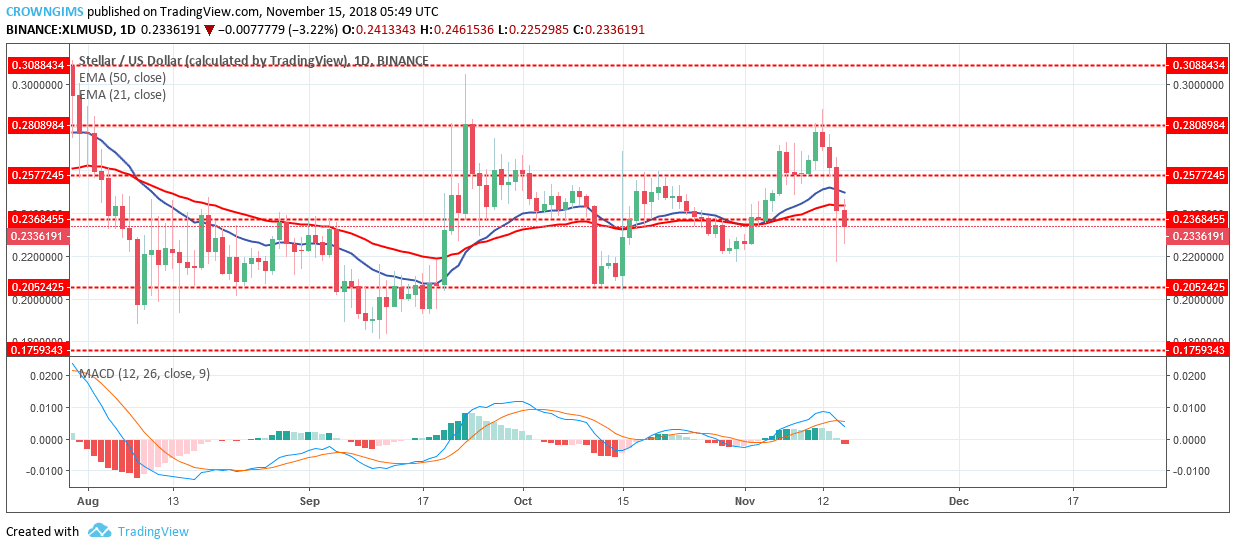
The next daily candle confirmed to the bears’ taking over the XLM market as it was a strong bearish candle that broke down the demand levels of $0.25 and $0.23 and closed below the dynamic support and resistance (the two EMAs).
The daily opening candle is bearish and it broke down the demand level of $0.23; it is an indication that downtrends may continue. Stellar price is currently trading below the supply level of $0.23 heading toward the demand level of $0.20. XLM price is below 50-day EMA and the 21-day EMA which indicates the bears’ pressure is still strong.
Moreover, the MACD period 12 with its histogram is below zero level with its signal lines pointing to the south which indicates a strong selling signal.
In case the bears continue with their increased momentum the Stellar price may have its target at the demand level of $0.20.
XLM/USD Price Medium-term Trend: Bearish
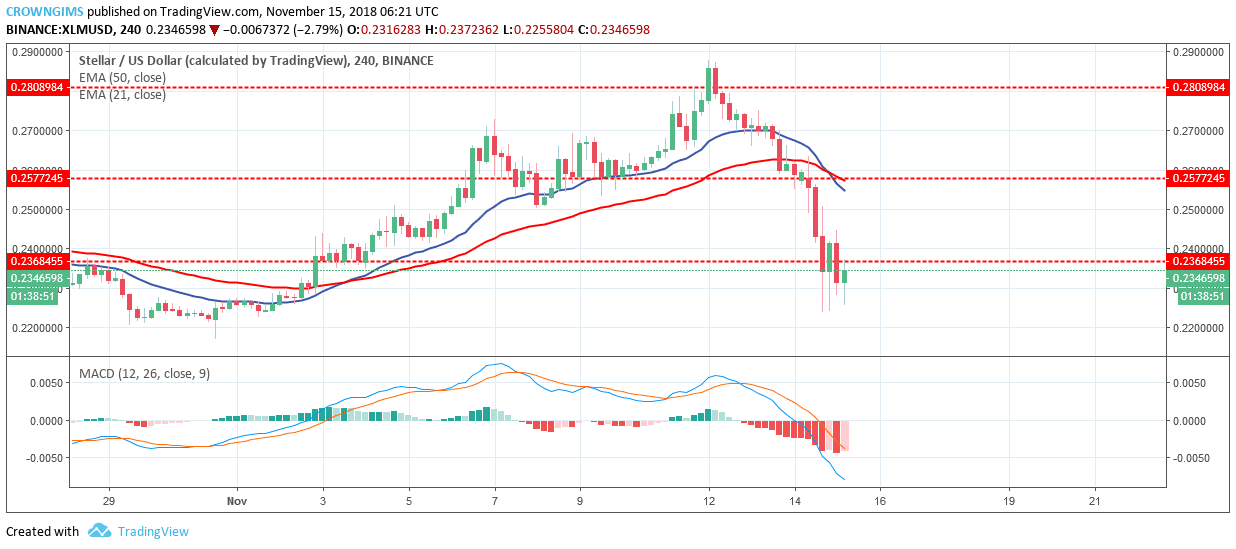
XLM price is currently below $0.23 supply level exposed to the demand level of $0.20. XLM price is below 21-day EMA and 50-day EMA which connotes bearish trend and also MACD with its histogram is below zero level with its signal lines point down indicates sell signal.


Article comments