XRP/USD Technical Analysis: Red to dominate green amidst market volatility?

XRP has been switching between greens and reds on a constant basis for the past week, reflecting the high volatility in the market. At press time, the coin was down by 2%, trading at $0.44, with a market cap of $17.8 billion. The 24-hour trading volume was recorded at $1.33 billion.
1-hour
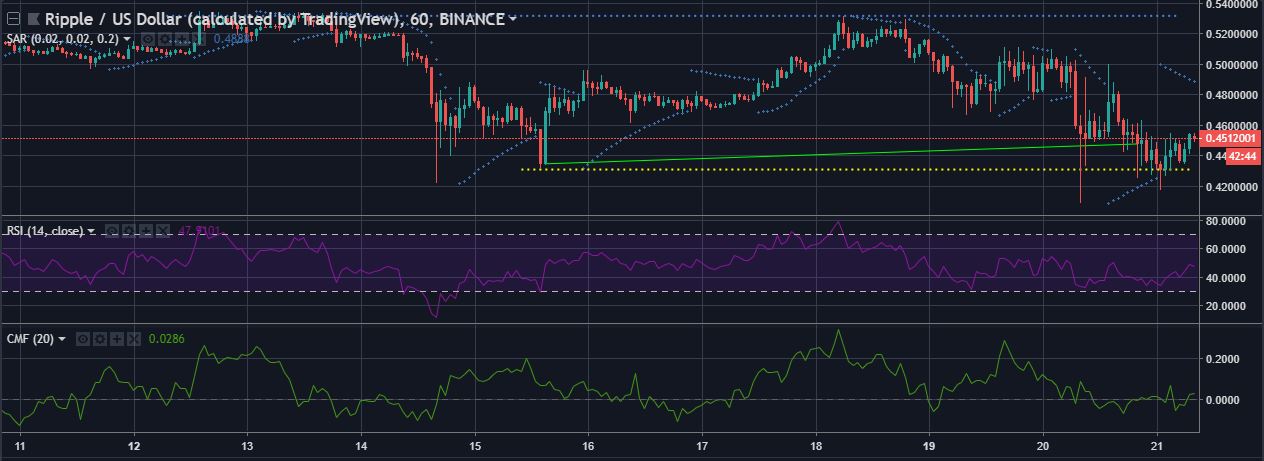
In the one-hour time frame, the candlesticks are experiencing a slight uptrend from $0.43 to $0.44, whereas the resistance point is set way above, at $0.53. This points towards the pre-existing high volatility in the XRP market that has caused much fluctuation in the price.
The Parabolic SAR is currently bearish on the XRP market. The dots have assembled above the candlesticks to speculate the bear’s victory.
The RSI is in tune with the Parabolic SAR with a similar prediction for the coin. The reading line is approaching downwards in favor of the bear.
However, Chaikin Money Flow is still moving upward, against the predictions made by its fellow indicators to cheer for the bull.
1-day

In this timeline, the XRP candlesticks are witnessing a steep uptrend that stretches from $0.27 to $0.44. Here, the resistance level is set at a high point of $0.58.
The Moving Average [MA] is pointing towards a downward trend in the XRP market as the indicator is slumping at a slight rate.
The Stochastic RSI has made a bearish crossover and is swimming in the oversold zone as of now. This is a clear indication that a reversal in trend may be observed sometime soon.
The Relative Vigor Index is neutral on the prediction of XRP at present. The RVGI has switched from bullish to bearish crossover in the span of two days.
Conclusion
In the technical analysis, it can be clearly observed that the majority of the indicators believe in a bearish market for the cryptocurrency. However, the volatility is high in the market, hence, there may be rapid trend reversals as suggested by the trendlines and the Stochastic RSI.


Article comments