XRP/USD Technical Analysis: Recovery from the bear seems plausible but not in sight

XRP is one of the few cryptocurrencies that has held up considerably well in the current bearish atmosphere. Unlike the rest of the cryptocurrencies in the market, the coin is not squirting blood everywhere. The coin, which has effectively taken over Ethereum’s position in the market, is currently trading at $0.41 with a market cap of $16.47 billion.
The trading volume of XRP is $616.94 million, most of which comes from ZBG exchange with XRP/USDT trading pairs. Binance contributes an equal amount of trading volume but with XRP/USDT and XRP/BTC trading pairs.
1 Hour:
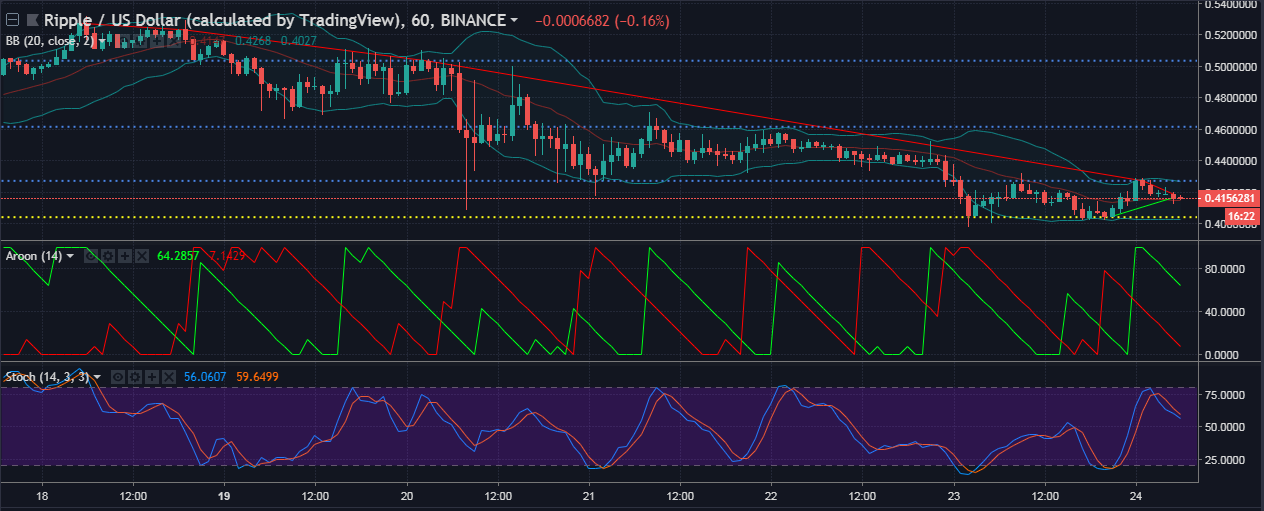
The downtrend for XRP in the one-hour chart extends from $0.5271 to $0.4186. A small uptrend is pictured, extending from $0.4046 to $0.4164. The coin has a support at $0.404 ground. The resistance points for XRP are set up at $0.4270, $0.4614, and $0.5033.
Bollinger Bands are undergoing a squeeze, which is another way to indicate low volatility. The prices are holding on the SMA line with red candles forming on it.
The Aroon up line is in full swing with it topping at the 100-line, which shows that an uptrend is in play.
The Stochastic shows a bearish crossover as the lines are hitting the 50-mark.
1 Day
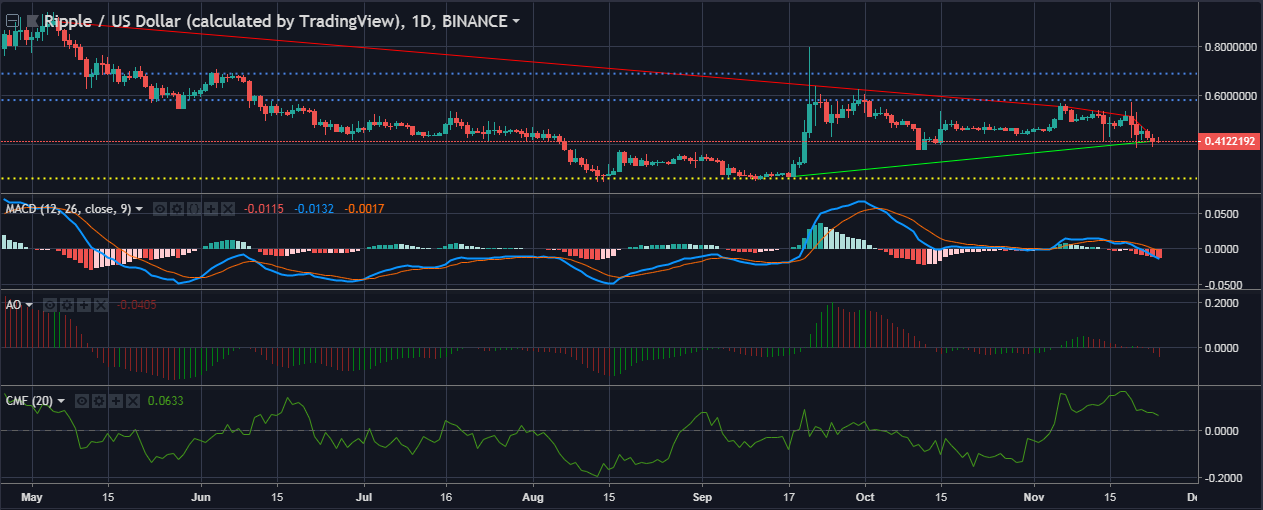
The uptrend for XRP in one-day time frame shows a promising sign, as it extends from $0.4145 to $0.2707, while the downtrend spans from $0.9027 to $0.4534. The support for XRP is set at $0.2627 while there are multiple resistance points that stretch from $0.5821 to $0.6899.
MACD is collapsing after a bearish crossover, the histogram is painted red because of the price drop.
The Awesome Oscillator shows a bearish crossover as the red spikes have shifted to the bottom of the zero line.
The Chaikin Money Flow demonstrates that the money inflow is slightly higher than the money outflow into the market.
Conclusion
The Aroon and the Stochastic indicators, both show a bearish presence underway, while the Bollinger Bands is showing a rather neutral stance. The one-day chart seems bullish but MACD and the AO indicators say otherwise.


Article comments