XRP/USD Technical Analysis: Fun roller-coaster ride is over; bear attack imminent

XRP had a fantastic rally today as it rose by 16% and the prices reached an approximate $0.33, while the market cap reached ~$14 billion.
The 24-hour time frame shows the trading volume at $862 million, and most of the trading volume is contributed by Japanese exchange BitBank via the trading pair XRP/JPY as it contributes a total of ~16% [$158 million].
1-hour
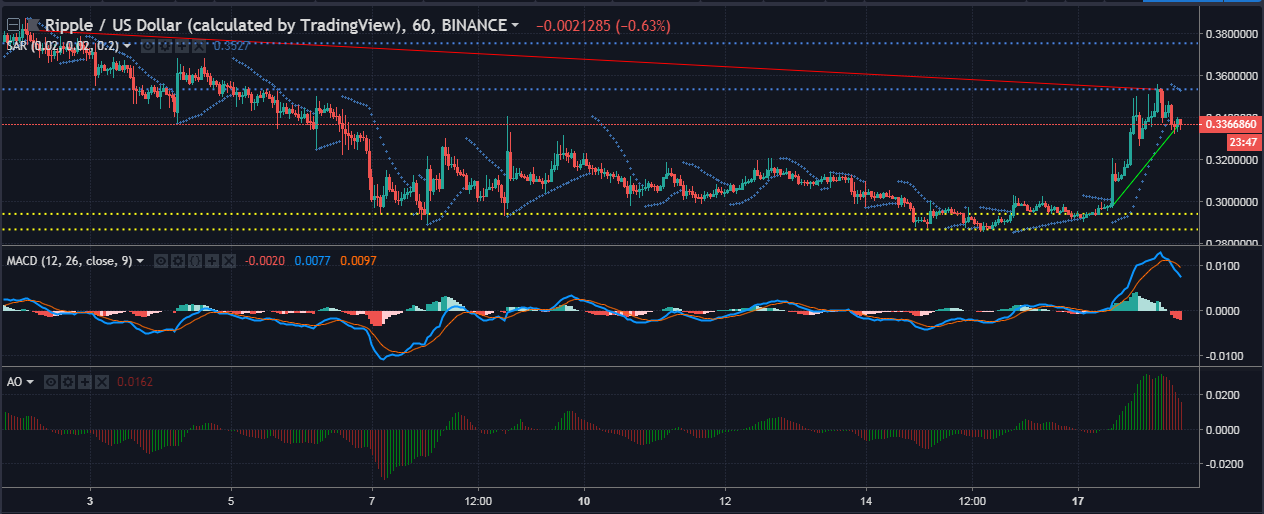
The one-hour chart shows an uptrend that extends from $0.2981 to $0.3358 and has started receding already. The downtrend extends from $0.3815 to $0.3533. XRP has broken the support at $0.2940 and set up a new support at $0.2866. The resistance points are too far from the actual candles and are hanging at $0.3533 and $0.3752.
Parabolic SAR shows the formation of markers above the prices, indicating that the uptrend has ended and bearish pressure has rolled back into the market.
MACD indicator also shows receding bullish signs and a take over by bears as the MACD line has crossed the signal line to the bottom, indicating a clear bearish crossover for XRP.
The Awesome Oscillator shows a transition of green lines into red lines, which is a clear indication of the decrease in prices.
1-day
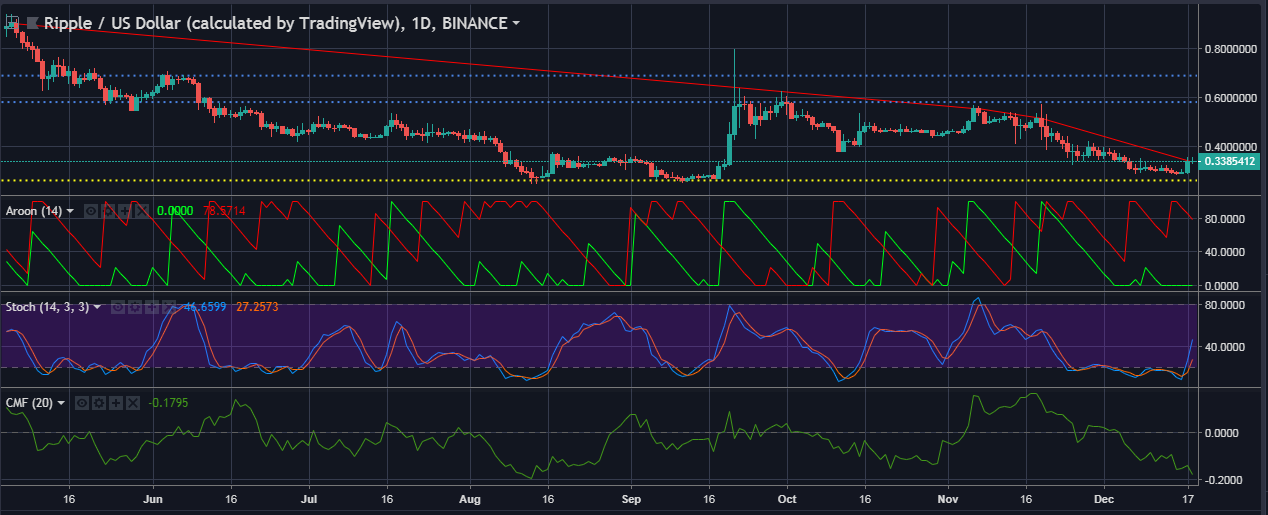
Today’s XRP rally didn’t dent even a little bit when seen in the longer time frame of the one-day chart, as there is uptrend erupting. The downtrend, however, ranges from $0.3379 to $0.9027. The prices are being supported at $0.2627, with resistance points hanging at $0.5821 and $0.6899.
The Aroon indicator shows that the downtrend line has hit the 100-line, which indicates that downtrend has come around from the corner and is in progress. The uptrend line in the Aroon indicator for one-day chart has collapsed to the bottom indicating that uptrend has expired.
The Stochastic indicator shows that it is trying to recover after undergoing a terrible crash.
The Chaikin Money Flow shows a crashed indicator that doesn’t seem to be stopping as sellers have taken control over the XRP market.
Conclusion
The one-hour chart looks grim as XRP has had its upward roller coaster ride and is now on a downward trend. which is clearly indicated by Parabolic SAR, MACD, and Awesome Oscillator. The one-day chart for XRP shows an equally bleak downtrend for the day, as the Aroon and CMF are both indicating a bear trend, while only Stochastic indicator shows positive signs.


Article comments