XRP/USD Technical Analysis: Ephemeral rally for XRP goes into a correction phase

XRP, the third largest cryptocurrency in the world has seen a lot of volatility in the market in recent days and so have every other top 10 cryptocurrencies which have followed Bitcoin’s short-term rally above the $4,000 point.
XRP is currently back to $0.37 range after enjoying its short-lived rally on January 6, 2019, 17:00 UTC. The market cap of XRP is at ~$15 billion, $1 billion dollars away from overtaking Ethereum [ETH].
1 Hour
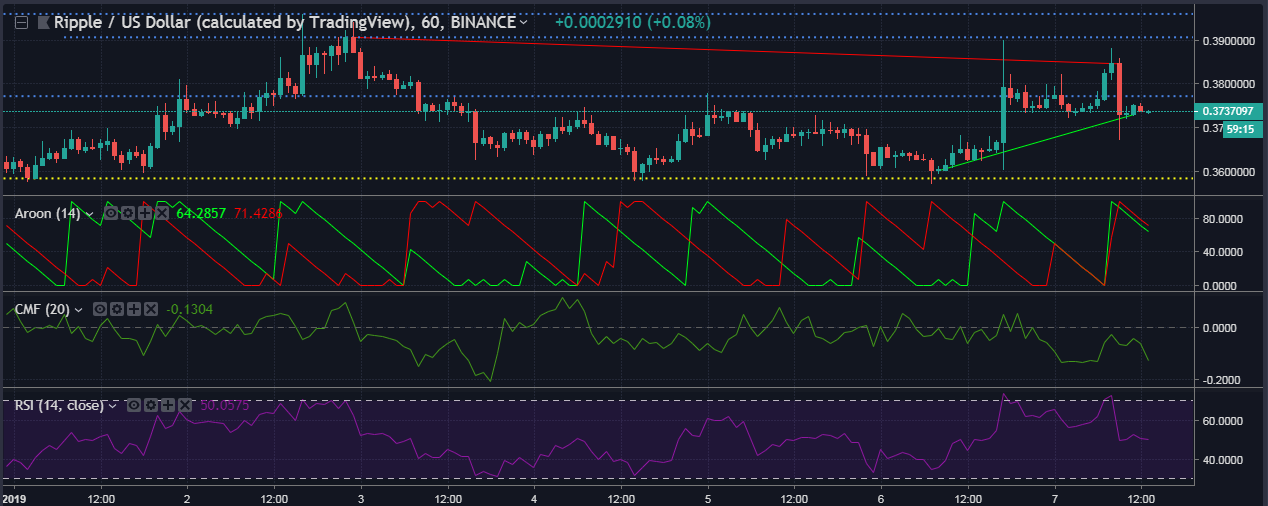
The one-hour chart of XRP shows a lot of volatility as the prices have broken their sideways trend, even if it was for a few moments. The uptrend extends from $0.3601 to $0.3729, while the downtrend extends from $0.3906 to $0.3845. The prices have yet to break the support at $0.3584 multiple times in the past. The resistance at $0.3771 was broken on the same day as the rally but has become a resistance again. Subsequent resistance points can be seen hanging at $0.3908 and $0.3959.
The Aroon lines are at almost the same position trend downwards, which indicates that the uptrend and the downtrend are both exhausted and the cryptocurrency is undergoing consolidation.
The Chaikin Money Flow has sunk below the zero-line, indicating that the money is flowing out of the market for XRP.
The Relative Strength Index shows the buying momentum for XRP is equal to that of the selling momentum.
1 Day
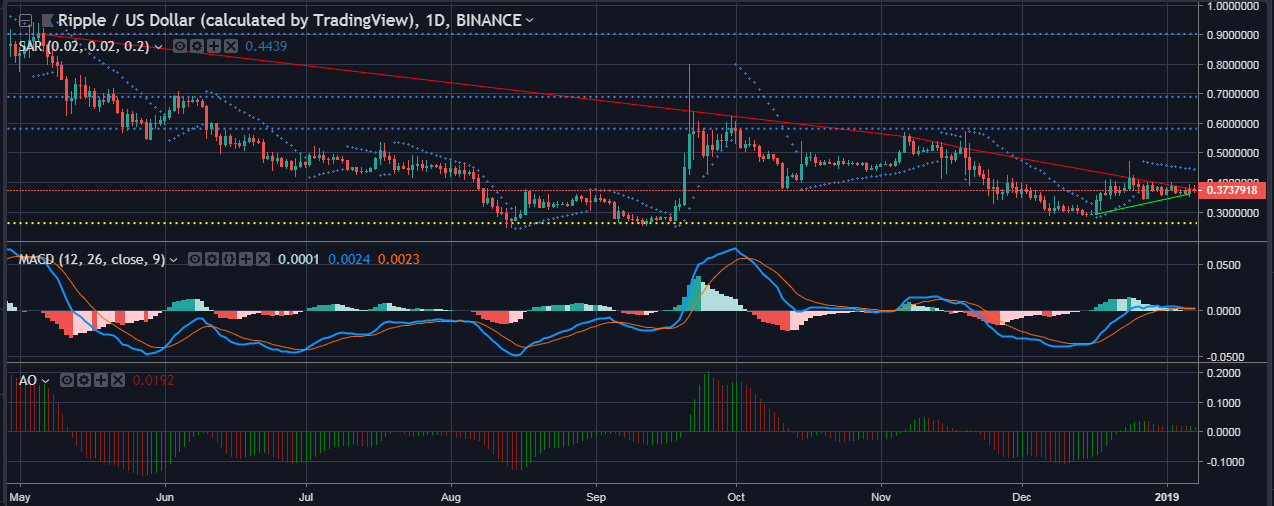
The one-day chart for XRP shows an uptrend that extends from $0.2931 to $0.3614, while the uptrend spans from $0.9027 to $0.3766. The support at $0.2627 is holding steady and the resistance points at $0.5821, $0.6899, and $0.9027 are yet to be tested.
The Parabolic SAR markers have spawned above the price candles and indicate a bearish pressure for XRP prices.
The MACD lines have come eerily close to each other and are hugging each other without signifying a definite crossover.
The Awesome Oscillator shows a set of bars above the zero line which are transitioning into red bars indicating that the momentum for XRP is decreasing [i.e., the prices are decreasing].
Conclusion
The one-hour chart, as indicated by the Aroon, CMF, and RSI shows a neutral trend for XRP in play while the one-day chart shows a slightly bearish outlook for XRP as indicated by SAR, MACD and AO indicators.


Article comments