XRP/USD Technical Analysis: Christmas rally leads to uptrend in bear market

XRP is very close to being accepted by the financial institutions as Ripple journeys on with partnerships. The prices of XRP have seen quite a rally last week and its effects are seen in the longer time frame.
The price of XRP, at the time of writing, was trading at $0.3702, with the market cap of $14.69 billion. The 24-hour trading volume is holding at $602 million.
1-hour
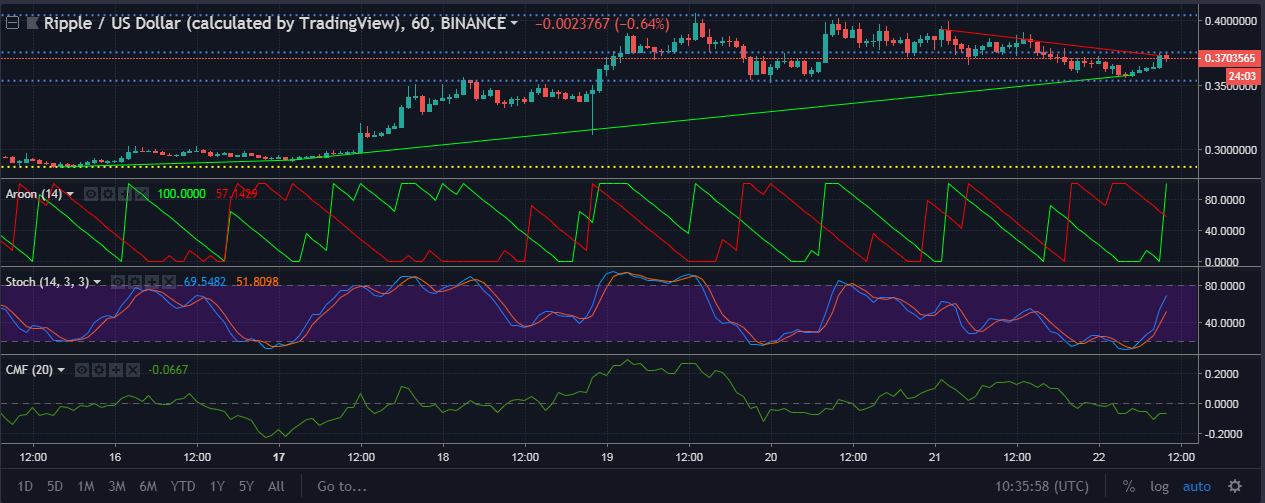
The uptrend for XRP has finally come to power as it extends from $0.286 to $0.3577, while the downtrend extends from $0.393 to $0.327. The prices for XRP in the one-hour chart are being supported at $0.2866. The resistance points are hanging at $0.3533, $0.3752, and $0.4040.
The Aroon indicator shows that the uptrend that was underway is in full strength, which means that the downtrend has exhausted.
The Stochastic indicator shows a positive sign as the Stochastic line has overtaken the signal line in a bullish crossover
The Chaikin Money Flow shows a negative outlook as the CMF is below the zero-line, indicating that the money flowing out of the market is still higher than the money influx into XRP markets.
1-day
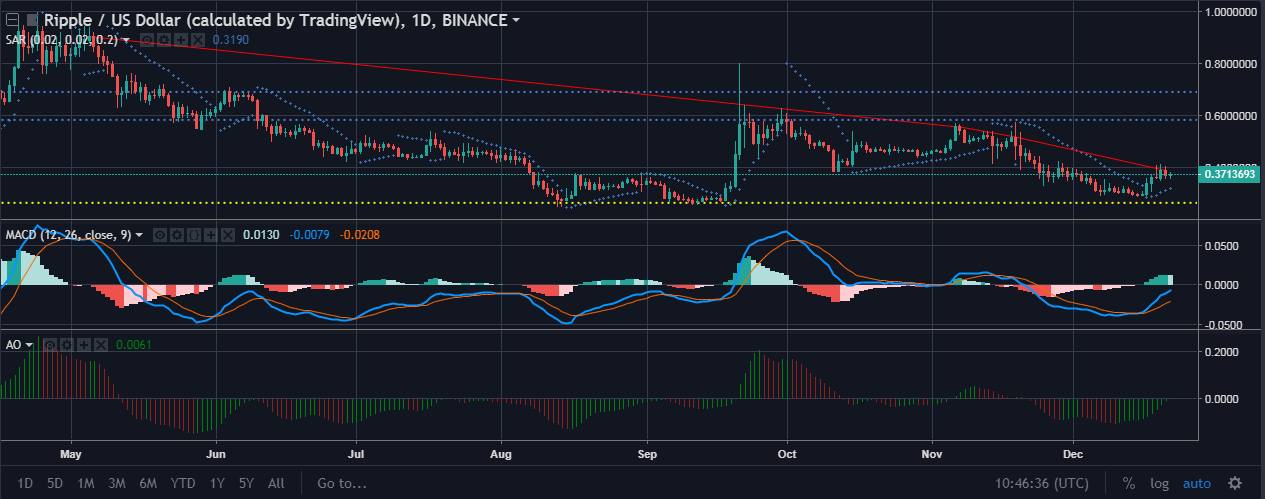
The downtrend for XRP extends from $0.9027 to $0.3873, with an uptrend yet to be formed. The prices are supported at $0.2627, with resistance points hanging at $0.5821, and $0.6899.
The Parabolic SAR shows a positive sign as the markers have formed below the price candles, indicating a bullish trend.
The MACD indicator shows a bullish crossover on the negative side of the zero-line and the lines are heading upwards.
The Awesome Oscillator shows green lines diminishing in height below the zero-line, indicating a possible bullish crossover.
Conclusion
The one-hour chart is lit up with green candles and is indicated by the indicators, Aroon, Stochastic, and CMF. The one-day chart also shows positive signs which are indicated by the SAR, MACD and the AO indicators.


Article comments