XRP/USD Technical Analysis: Beginning of a major bull run for the cryptocurrency

The crypto market has shown a significant bull trend this weekend as all the coins are back in the green zone. According to CoinMarketCap, XRP is trading at $0.37 with a market capitalization of $15 billion. The cryptocurrency has shown a growth rate of 27.9% in the weekly statistics. The highest trading volume of 12% is currently being noticed on the Japanese exchange platform, Bitbank.
1-hour:
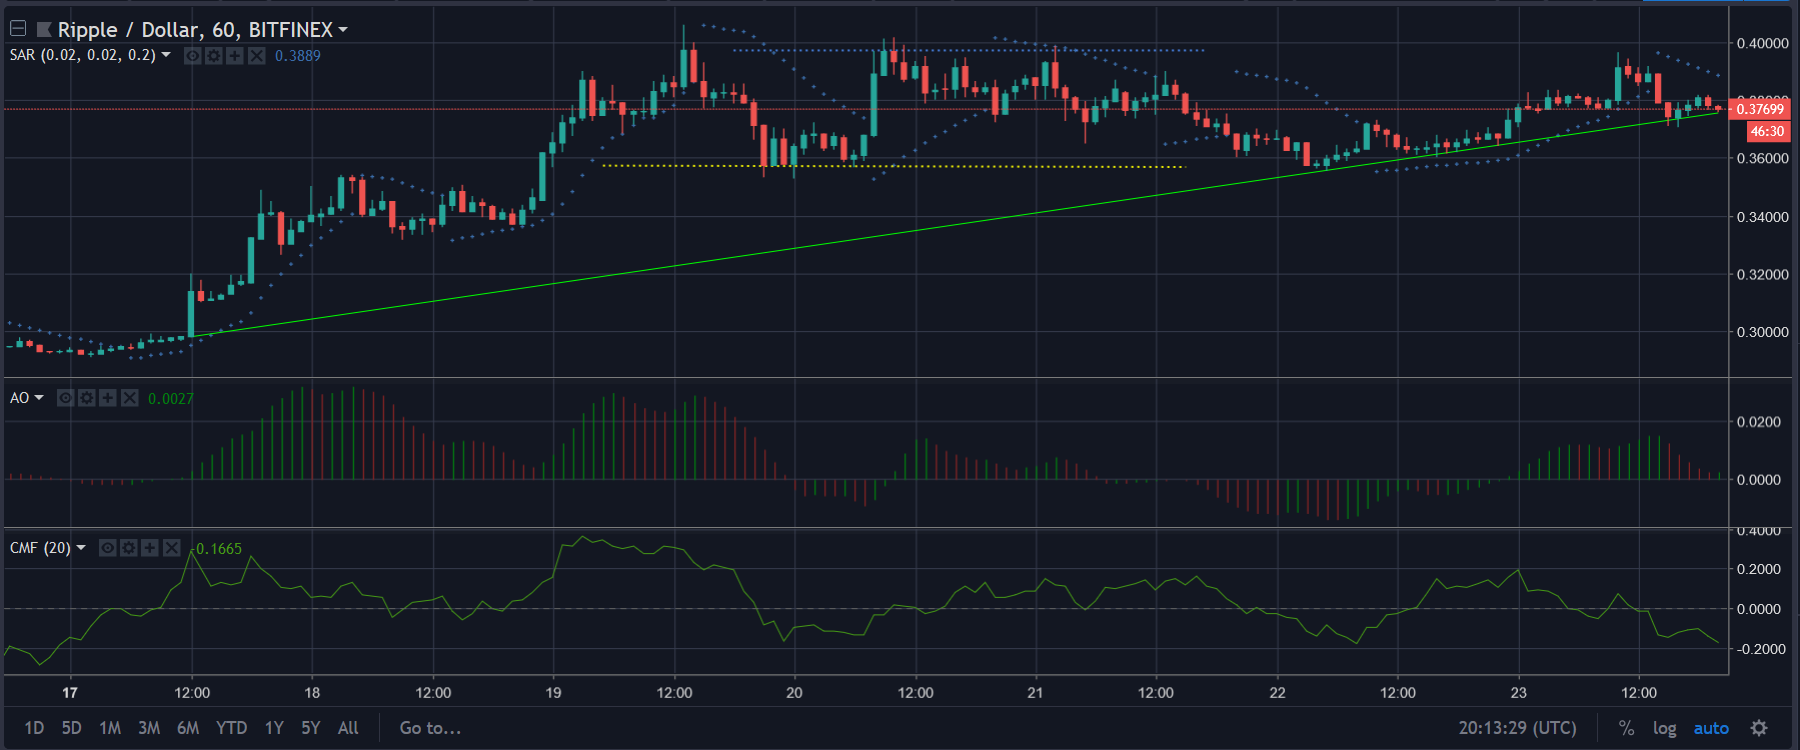
The 1 hour chart of XRP shows an uptrend extending from $0.297 – $0.377. The support and resistance levels for this timeline are set at $0.357 and $0.397 respectively.
The Parabolic SAR is currently forming the dotted indicators above the candlesticks by slightly pushing the price downwards. However, it can be noticed that this bear trend is emerging after a strong bullish signal which existed for more than a day.
The Awesome Oscillator has maintained the bars above the zero line which is slowly changing to green at the moment.
Chaikin Money Flow [CMF] is moving below the zero line indicating a less inflow of money in the XRP market in this timeline.
24 hours:
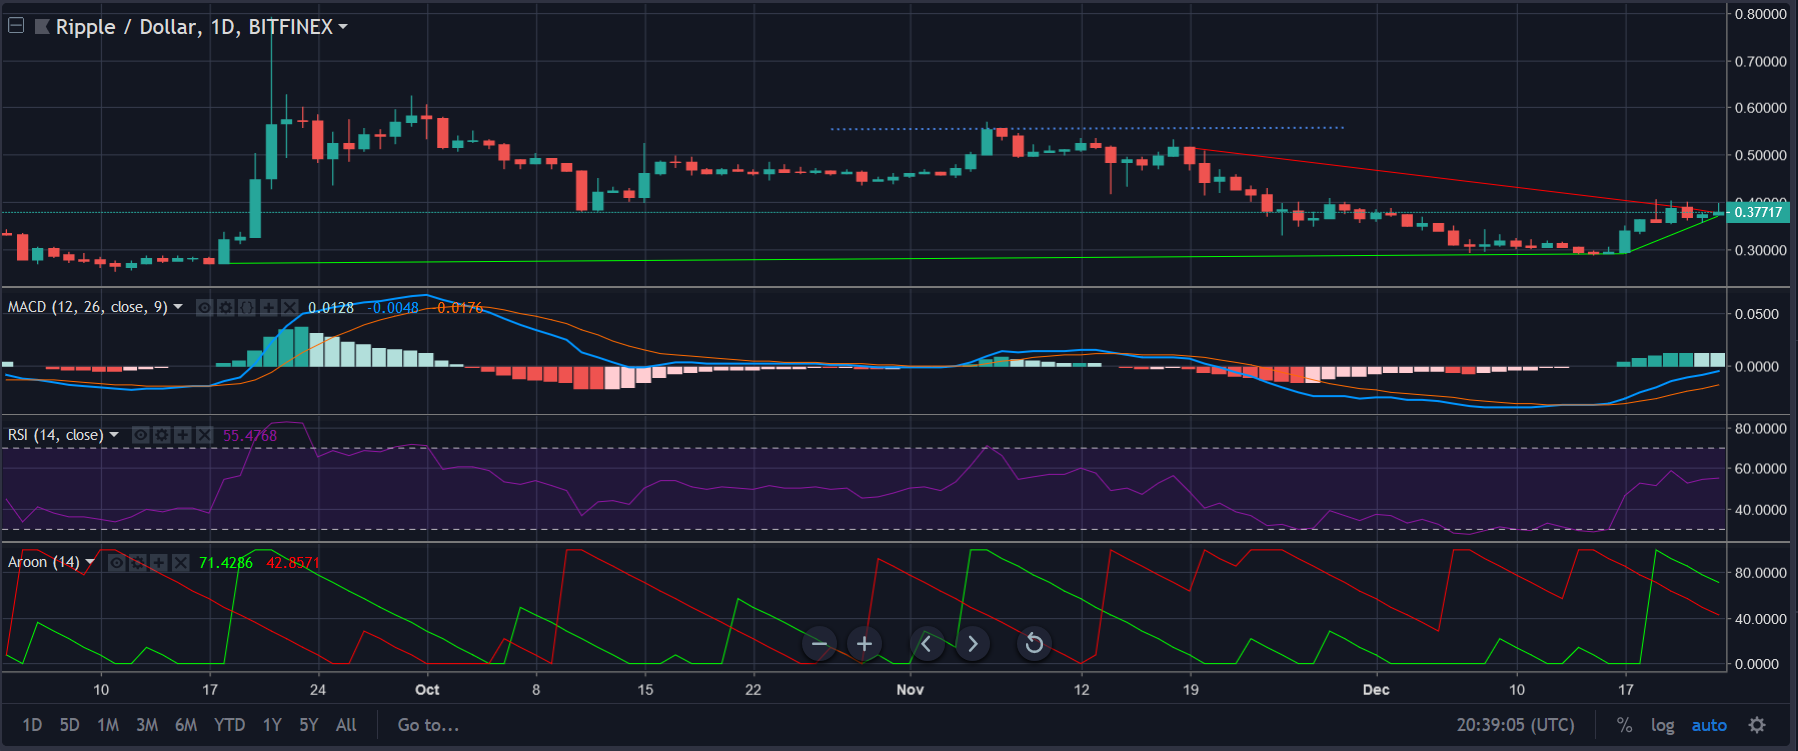
The daily chart of XRP shows an uptrend ranging between $0.26 – $0.28 – $0.37, while the downtrend is ranging between $0.52 – $0.377. Also, a resistance point is set at $0.56.
The MACD has taken a bullish crossover with the moving average line continuing its journey above the signal line. The histogram has formed a set of strong green bars indicating the bull trend on a long run.
The Relative Strength Indicator [RSI] depicts a bullish trend as it is moving towards the overbought zone in this timeframe.
Aroon Indicator is showing more strength in the uptrend which gives a positive sign and the downtrend is exhausting.
Conclusion:
In this technical analysis, the short term indicators are depicting a slight bearish trend. However, all the three indicators on the daily chart is predicting a strong bullish trend on a long run.


Article comments