XRP/USD Technical Analysis: Bears not invited to bull’s homecoming

Unlike most of the big coins across the cryptocurrency board, XRP, the third-largest token has taken a flight, becoming the largest gainer under the top-20 list. The ecosystem is currently witnessing a lot of development and changes in terms of API as well as adoption. Therefore, the market success of XRP does not come as a surprise in the community.
At the time of writing, the token was up by 3.77%, trading at an appreciated price of $0.52 with a market cap of $21 billion. The 24-hour trade volume was recorded at $699.7 million.
1-hour:
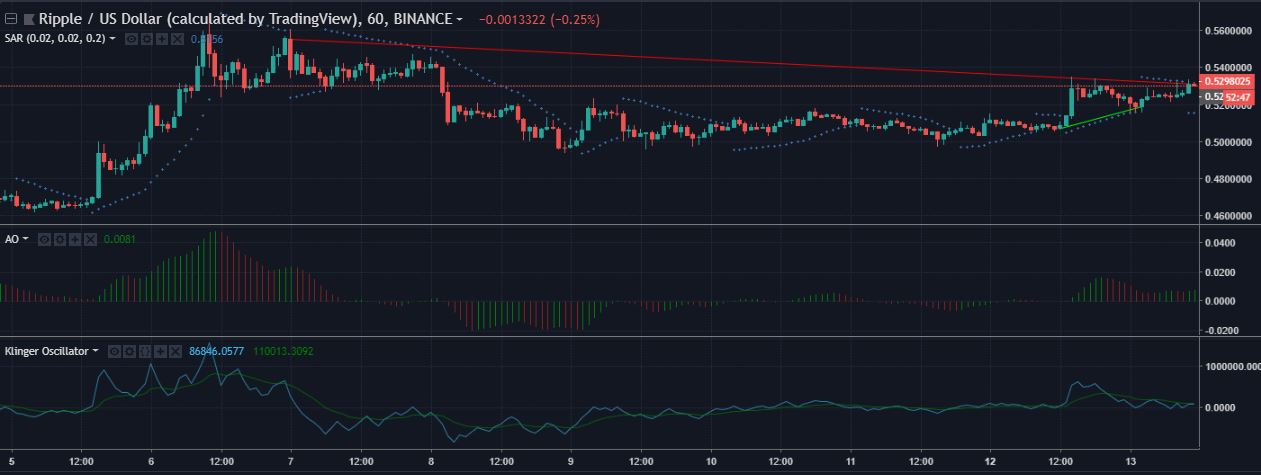
The one-hour duration of XRP candlesticks shows a downtrend extending from $0.55 to $0.53 whereas the uptrend is observed from $0.5 to $0.51. A strong support is set at $0.49 to keep the prices from falling deeper. The price trend is not experiencing much compression as of now, therefore, a trend breakout does not seem feasible at this point.
The Parabolic SAR was previously bearish on the XRP price trend. However, the indicator has taken to the other side of the road to side with the bull. The dots are currently aligned below the candlesticks to display support for a positive price trend.
The Awesome Oscillator is flashing green at the market as well, behaving similarly as the above indicator.
The Klinger Oscillator seems to be catching up with the above indicators to hold a bullish grip. The indicator was running bearish, below the signal line but is approaching upwards to make a green crossover and join the others.
1-day:
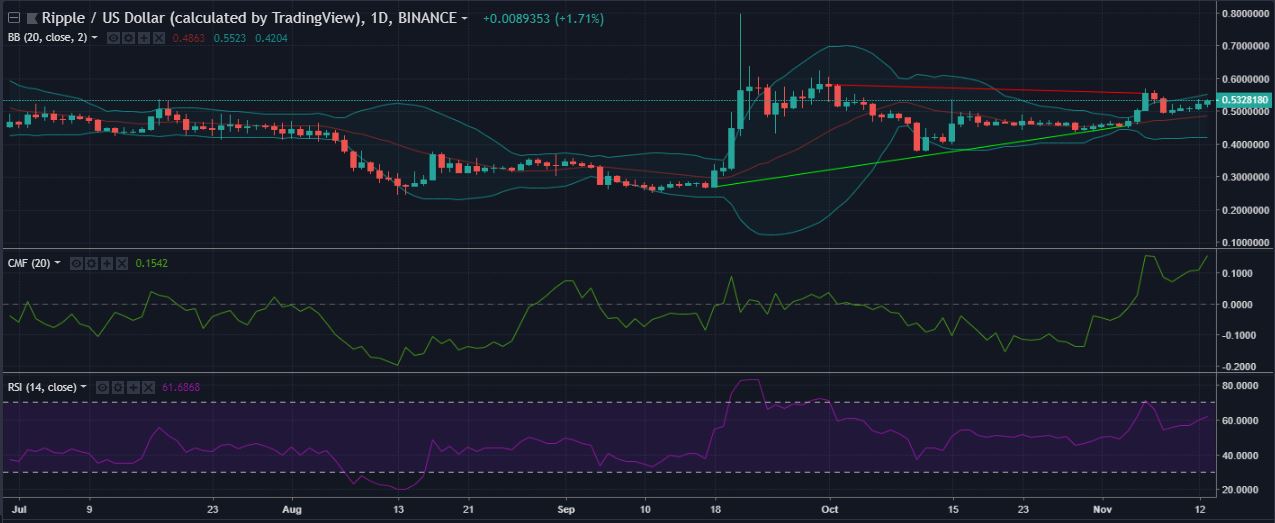
The one-day case is presenting the trendlines from $0.58 to $0.55 as a downtrend and $0.27 to $0.45 as an uptrend. A trend breakout is not reflecting a possibility in the current scenario as there is much gap for price fluctuation to occur.
The Bollinger Bands compressed the price trend by following a narrow path previously, but are back to a widened pattern. The indicator is depicting a higher volatility for the XRP market.
The Chaikin Money Flow has trekked the steep uphill road to hit the ceiling. The indicator is evidently above the 0-mark to crash the bullish party.
The RSI returned after making contact with the overbought zone. The indicator has begun its journey to the same path again and is taking an upward approach to indicate a bullish trend.
Conclusion
In the technical analysis, all the indicators are suggestive of a bull run for the XRP market. The coin has been seeing short-period rallies on a frequent basis for a week now. The Bollinger bands have also predicted an increased volatility in the market, making the fate of XRP interesting to track.


Article comments