XRP/USD Technical Analysis: Bears have overpowered the bulls in the brutal doom-December of 2018

The XRP prices have been down in the dumps for a long time as the bear market has been brutal yet fair to every cryptocurrency.
The market cap of XRP is holding steady at $12.58 billion with prices at $0.3074, and the 24-hour trade volume hanging at $363 million.
1 Hour
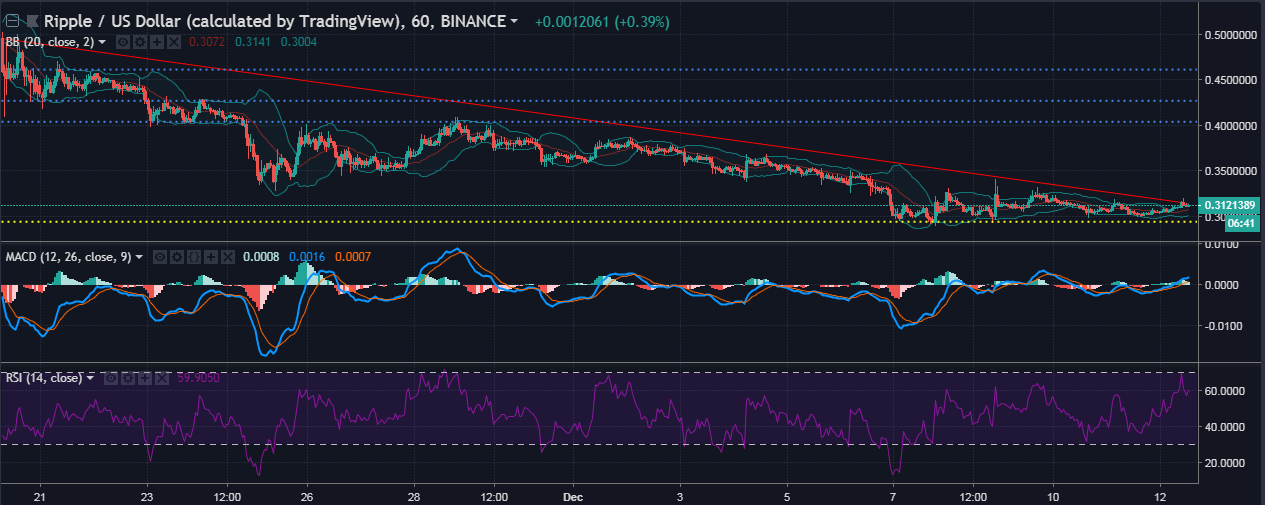
The uptrend for XRP doesn’t seem to be forming anytime soon in the one-hour time frame but the downtrend seems strong as it extends from $0.4955 to $0.3149. The support for XRP hangs at $0.2940, while the resistance points are seen hanging at $0.4040, $0.4270, and $0.4614.
The Bollinger Band shows an oversold exposure for XRP prices. The prices have breached the upper band indicating an oversold position for XRP
The MACD indicator shows a bullish crossover that is in progress and the prices have extended above the zero-line.
The RSI indicator for the one-hour time frame shows a clear overbought market, as the XRP has breached the overbought zone and is coming back in.
1 Day
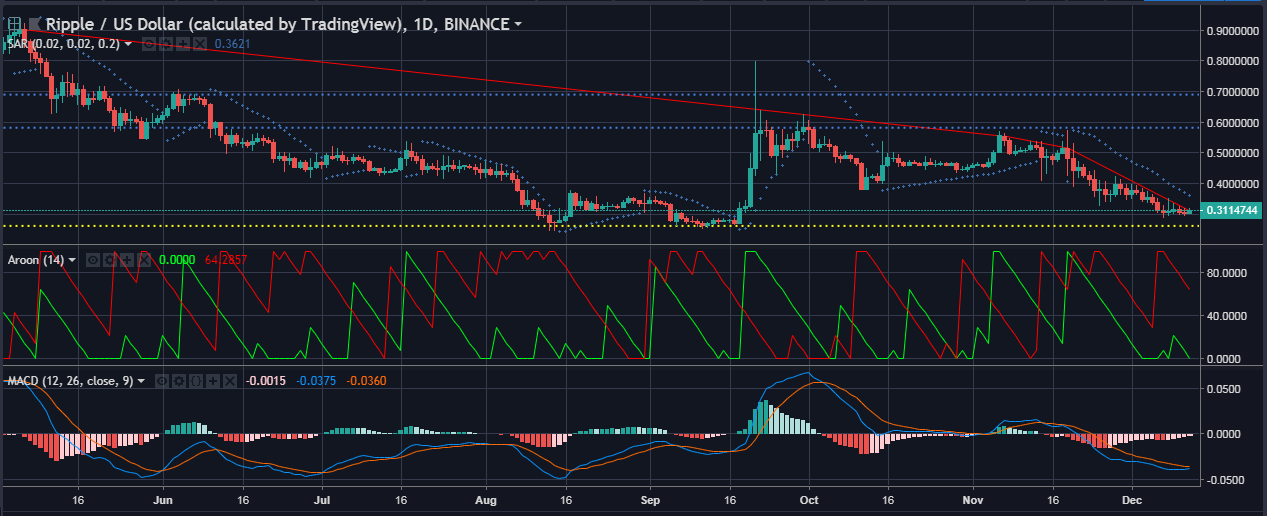
The uptrend for XRP doesn’t seem to be forming in the one-day time frame, while the downtrend $0.9027 to $0.3119
The support line for XRP can be seen holding steady at $0.2627, while the resistance lines are seen ranging from $0.5821 and $0.6899.
The Parabolic SAR indicates a bearish presence for XRP as the SAR markers have formed above the prices candles.
The Aroon indicator shows the red-line that has gained prominence as it has hit the 100-line, while the green-line, which represents the uptrend has lost its strength as it is down in the dumps.
MACD indicator for XRP in the one-day time frame shows a prolonged bearish crossover that is still in play, but the lines are getting closer to each other.
Conclusion
The one-hour chart shows a very bullish sign for XRP prices as indicated by the Bollinger Bands, MACD and RSI. The opposite is true for the one-day chart as every indicator in the image above shows a bearish presence.


Article comments